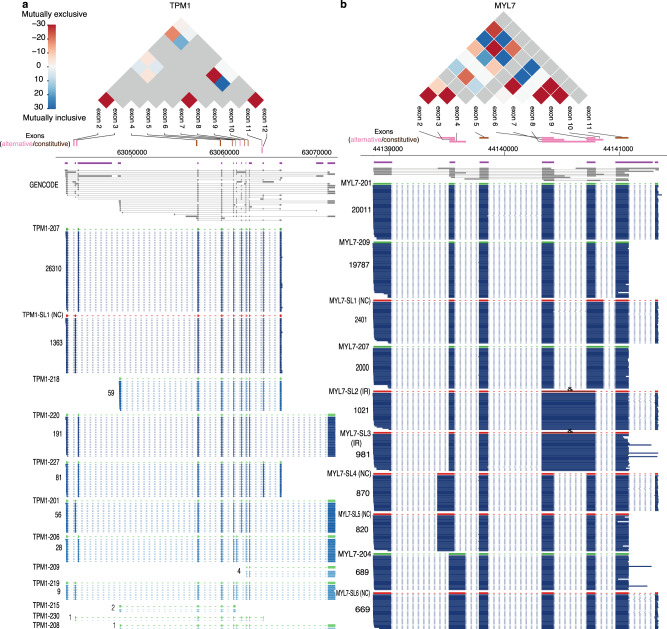
Fig. 3. Exon co-associated events in human iPSC-CMs.
TPM1 (a) and MLY7 (b) are shown as examples of genes containing multiple adjacent and distal mutually inclusive or exclusive alternative exons. The co-association strength (log10 of p-value) between alternative exon pairs is illustrated in the triangle plot for mutually exclusive (red, −) and inclusive pairs (blue, +), while the gray color indicates exon pairs not tested. Purple and gray annotations are for collapsed and expanded GENCODE comprehensive annotation, respectively. Reads in blue are in the same log-scale as Fig. 1 with darkness correlating with the read counts. Only exons used for our co-association analysis are shown. Lowly abundant transcript isoforms are not shown for illustration clarity. Source data are provided as a Source Data file.

