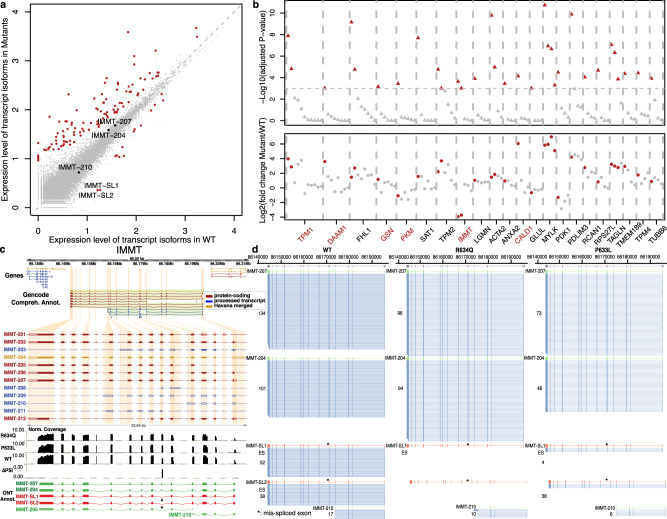
Fig. 4. Differentially expressed full-length transcript isoforms in the RBM20 mutants R643Q and P633L.
a Scatter plot for average full-length isoform expression levels in WT and mutants. Each dot represents an isoform, with red dots highlighting the differentially expressed ones (adjusted P < 0.001). Isoforms for IMMT gene are labeled. b Genes containing differentially expressed isoforms. Top, significance level of the differential expression analysis for each isoform (triangle) with significant ones in red. Bottom, fold change of expression level of each isoform (point) with significant ones in red. Gene names in red are genes differentially expressed only proportion of their isoforms, with no significant change at the total gene expression level. Only genes with more than three expressed isoforms are displayed. c IMMT gene with GENCODE annotation, short-read data and identified transcript isoforms in long-read data of this study. Tracks from top to bottom: collapsed view of GENCODE transcripts around IMMT locus, expanded view of IMMT GENCODE transcripts, short-read coverage for mutant and WT, delta-PSI between mutant and WT inferred in short-read data, and known (green) and novel (red) transcripts identified in long-read data. GENCODE transcript type are color-coded with red (protein-coding), blue (processed) and gold (Havana-merged). Coding regions are highlighted by filled color in the GENCODE annotation tracks. d Side-by-side comparison of IMMT isoforms expression in RBM20 R634Q, P633L mutant and WT. Two novel transcript isoforms in red, IMMT-SL1 and IMMT-SL2, were only expressed in WT samples. Known GENCODE transcripts are in green and raw long-reads are in blue. The mis-spliced exon 6 is indicted by asterisk. IMMT-205 and IMMT-208 were omitted due to low read count (1 in all samples). Source data are provided as a Source Data file.

