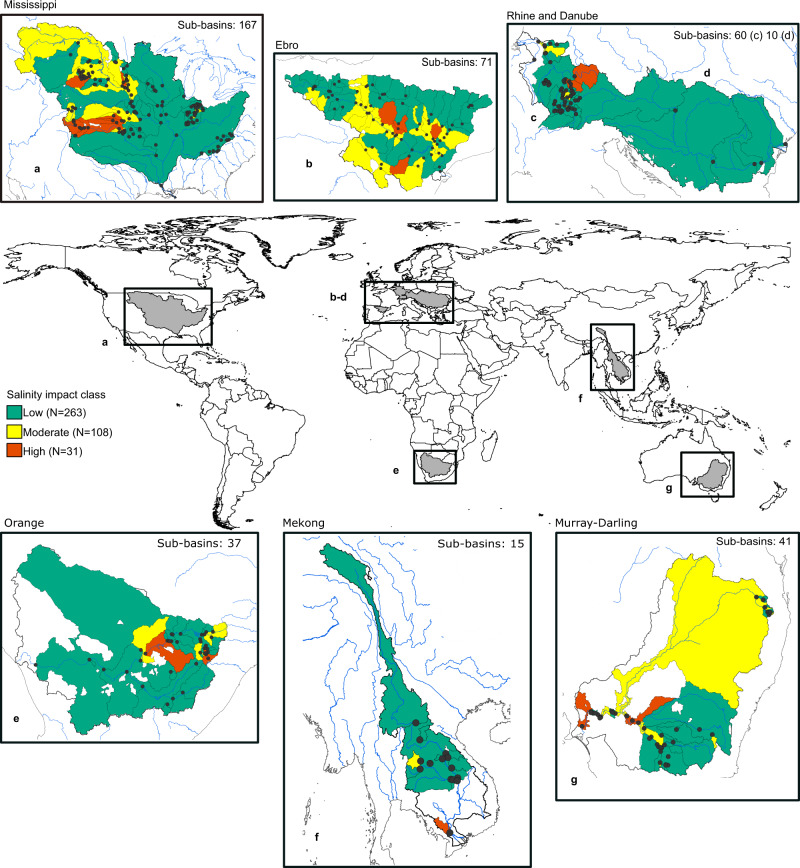
Fig. 2. Long-term average salinity levels across the studied river sub-basins.
Overview of the seven selected regional river basins and associated delineated 401 sub-basins from monitoring locations (black dots), with number of sub-basins of each regional river basin given in each zoomed panel. The salinity (EC) data availability criteria per monitoring station is at least 15 years of monthly data over the 1980–2010 period. The full distribution of salinity measurements per station is given in Supplementary Fig. S1.2. Each sub-basin is classified into different salinity impact classes, based on thresholds for irrigation water use, with Low (EC < 700 µS cm−1; green colour), Moderate (<700–1500 µS cm−1; yellow colour) and High (>1500 µS cm−1; orange colour) classes and associate total number of sub-basins within each class (N), based on long-term annual average EC over the 1980–2010 period. Sub-basins in white did not meet the data criteria of stations with a minimum of 15 years of monthly salinity data within the study period.

