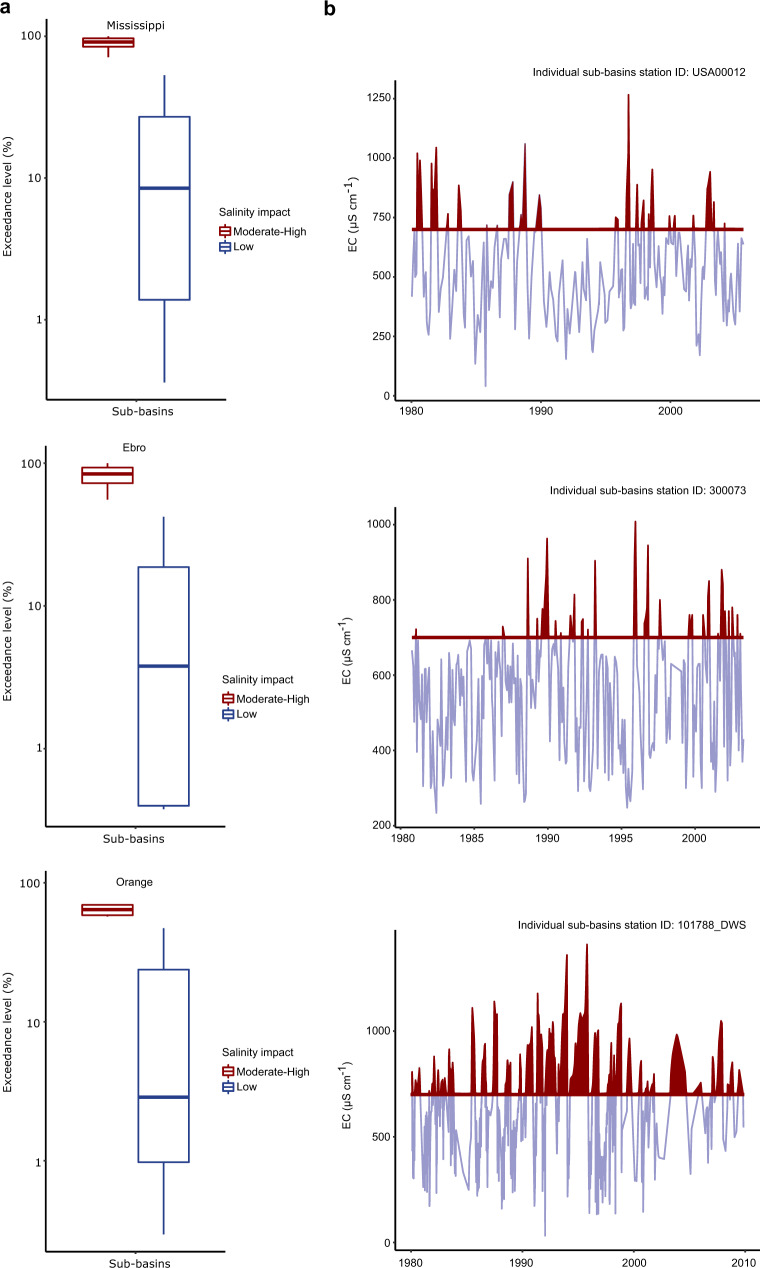
Fig. 3. Distribution and timeseries of sub-basin salinity threshold exceedance.
Panel a shows three examples of the distribution of sub-basin salinity exceedance levels (% of months exceeding the threshold 700 µS cm−1 compared to total number of monthly measurements for each sub-basin) within the Mississippi, Ebro and Orange regional river basins, grouped over sub-basins within the Low salinity impact class (i.e., sub-basins with long term annual average salinity values below 700 µS cm−1; blue boxplots), and sub-basins within the Moderate-High salinity impact class (i.e., long-term salinity levels above 700 µS cm−1; red boxplots). Panel b shows monthly timeseries of one individual sub-basin station from the Low salinity impact class (selected from the longest timeseries available), from each river basin example in a, with salinity levels exceeding the threshold highlighted in red.

