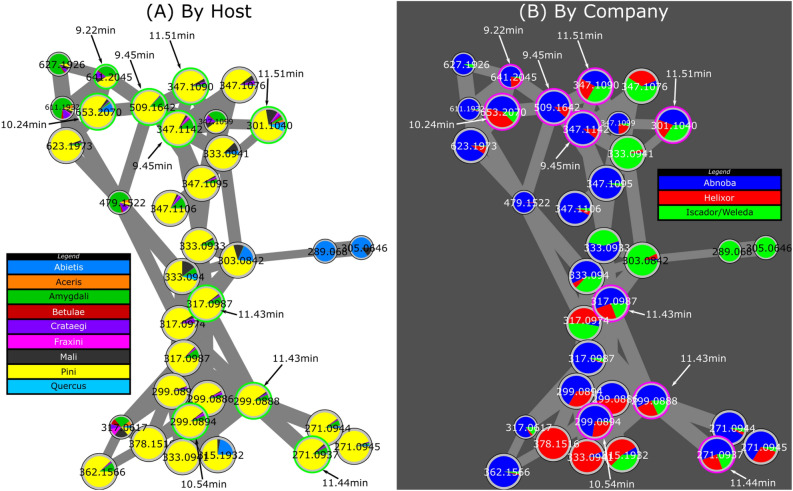
Figure 4.
Molecular network of specialized metabolites annotated in crude extracts of Viscum album L. by LC–MS/MS analysis. Cluster related to isoflavonones (circled in green in Fig. 2). Pie charts are either related to the host (A) or to the producer (B). Green circles (left) and red circles (right) pointed with their respective retention time correspond to features discriminant for pini and common to two or three compagnies. Color legend for pie charts (A) and (B) are indicated on the side of the sub-cluster. See also Supplementary Table S2 for quantitative data.

