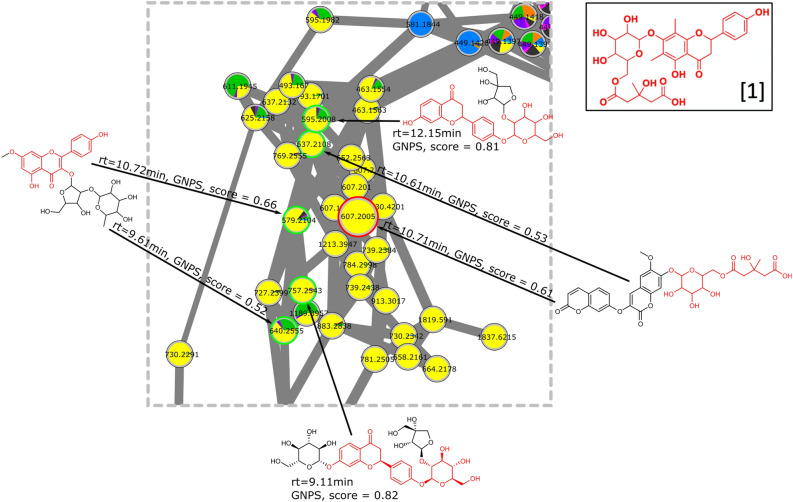
Figure 6.
Molecular network of specialized metabolites annotated in crude extracts of Viscum album L. by LC–MS/MS analysis. Cluster related to glycosylated flavanones (circled in red in Fig. 2). Analogs (green circles) from database search implemented in MetGem software. Substructures colored red are in common with the structure of [1], Supplementary Fig. S2 (node with the red circle). pie charts are related to the host (same legend as Fig. 4a).

