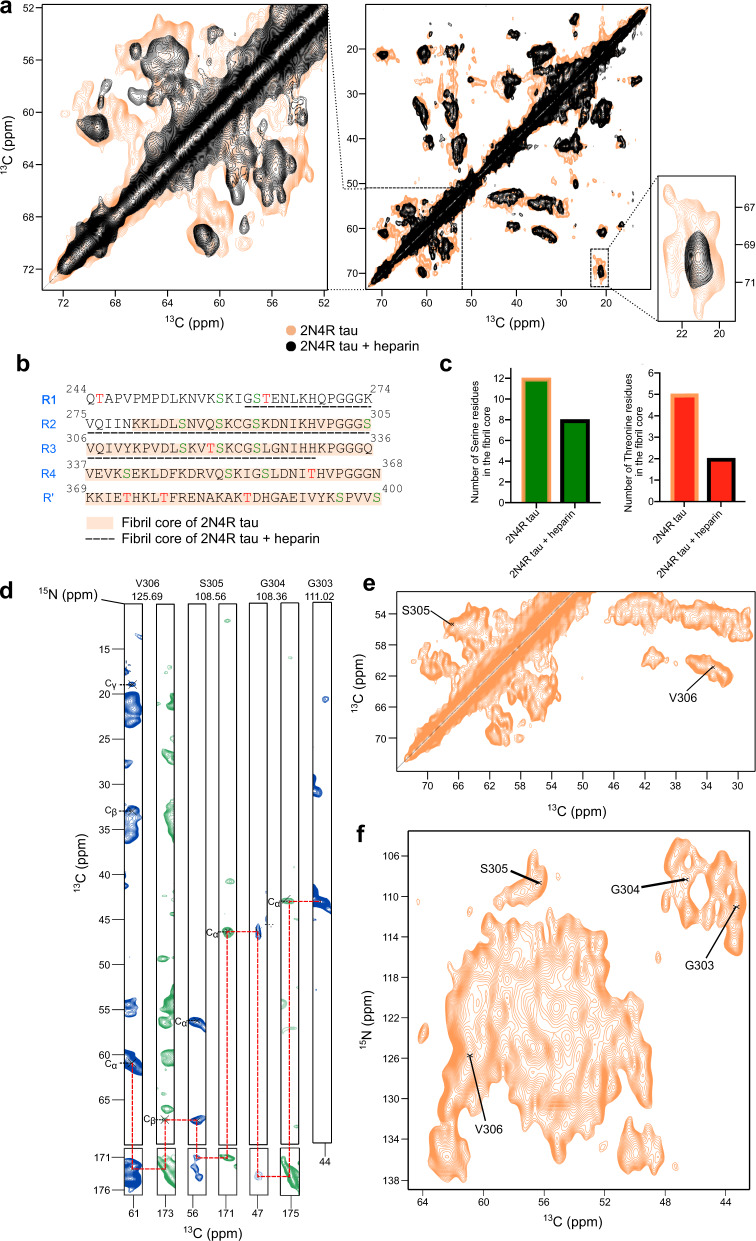
Fig. 3. Solid-state NMR of the core of heparin-free tau fibrils.
a 13C-13C RFDR spectra of 2N4R tau fibrils (middle panel), which were aggregated without (orange) or with heparin (black). The Cβ region of serine and threonine residues is highlighted on the left, the Cγ region of threonine to the right. b Amino acid sequence of the repeat region of 2N4R tau. Serine residues are colored in green, threonine residues in red. The core of heparin-free 2N4R tau fibrils is highlighted in orange. The fibrillar core of heparin-induced 2N4R tau fibrils is underlined with black dashed lines. c Number of serine and threonine residues in the core of 2N4R tau fibrils that were formed in the absence or presence of heparin (according to (b)). d, Strips from 3D NCACX (blue) and 3D NCOCX (green) spectra of heparin-free 2N4R tau fibrils, illustrating the sequential assignment of residues. e Selected region of the 13C-13C RFDR spectrum of heparin-free 2N4R tau fibrils, indicating the assignment of the cross peaks of residues S305 and V306. f 2D NCA spectrum of heparin-free 2N4R tau fibrils, indicating the assignment of the cross peaks of residues 303-306 (based on (d)).

