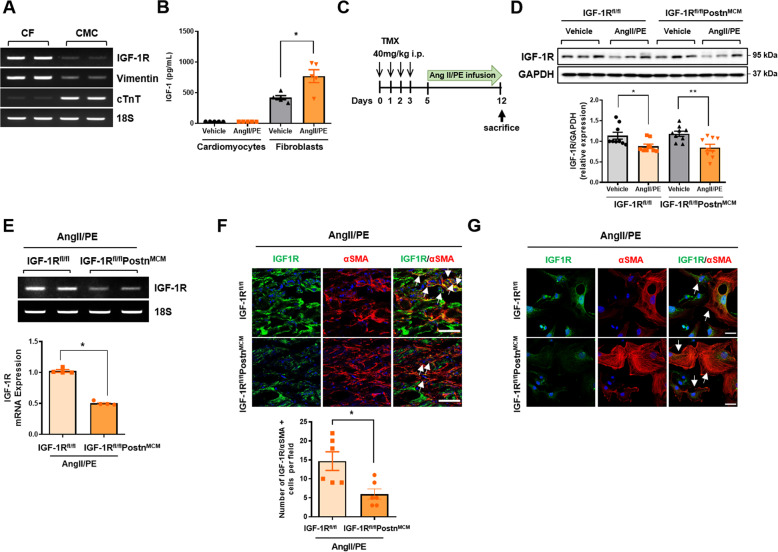
Fig. 1. Inducible myofibroblast-specific deletion of IGF-1R in mouse heart.
A Semiquantitative RT-PCR analysis of Igf-1r mRNA expression in C57BL6 mouse cardiac fibroblasts and cardiomyocytes, characterized by vimentin and cardiac troponin T (cTnT), respectively. B Cardiomyocytes and fibroblasts were isolated from AngII/PE-infused C57BL6 WT hearts and cultured for 72 h. IGF concentrations in culture media were measured by ELISA. n = 5/group. C Schematic diagram of the experimental procedure. WT (IGF-1Rfl/fl) or CFIGF1RKO (IGF-1Rfl/flPostnMCM) mice were administered tamoxifen intraperitoneally for four consecutive days. From day 5, the vehicle or AngII/PE mixture was infused by an osmotic minipump for 7 days, and the hearts were harvested. D Western blot analysis (upper panel) and densitometric ratios (lower panel) of IGF-1R. Group sizes: WT vehicle (n = 9), WT AngII/PE (n = 9), CFIGF1RKO vehicle (n = 9), CFIGF1RKO AngII/PE (n = 9). E Expression of Igf-1r mRNA in differentiated cardiac fibroblasts from AngII/PE-infused WT or CFIGF1RKO hearts. Representative RT-PCR is shown (upper panel). Relative levels of mRNA expression were normalized with respect to the levels of 18S and the mRNA level of WT hearts was arbitrarily set as 1. n = 4/group. F Double immunostaining of myocardial cryosections of AngII/PE-infused WT and CFIGF1RKO mice with anti-IGF-1R (green) and anti-αSMA (red) antibodies (upper panel) and quantification (lower panel). Nuclei were stained with DAPI (blue). Merged images are shown (magnification, ×40, scale bar, 50 µm). To quantify IGF-1R/αSMA-positive cells (arrows), a number of αSMA-expressing cells were counted based on the cells expressing IGF-1R. Group sizes: WT AngII/PE (n = 6), CFIGF1RKO AngII/PE (n = 6). G Representative immunostaining for IGF-1R (green), αSMA (red) in isolated cardiac myofibroblasts from AngII/PE-infused WT and CFIGF1RKO mice. Arrows indicate stains of IGF-1R/αSMA. Nuclei were stained with DAPI (blue). Merged images are shown (magnification, ×40, scale bar, 25 µm). Data are presented as the mean ± SEM. *P < 0.05; **P < 0.01.

