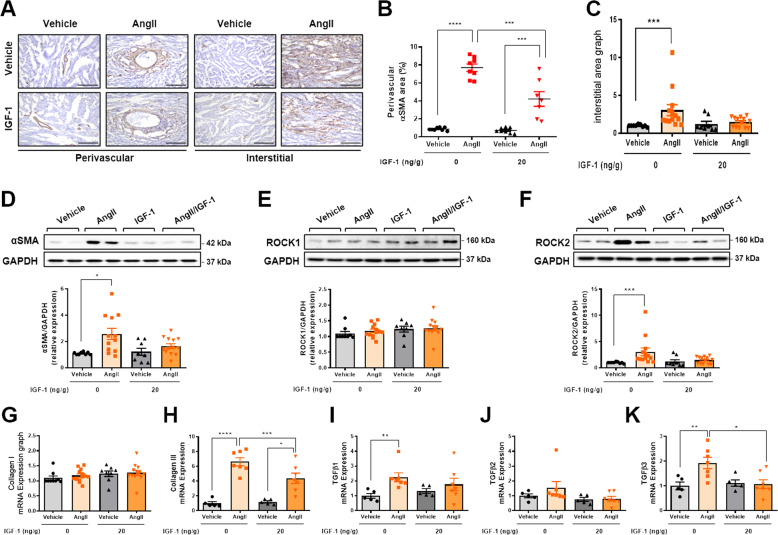
Fig. 5. Decreased myofibroblast differentiation and fibrosis-associated genes in IGF-1-treated fibrotic hearts.
A Representative images of αSMA immunostaining (magnification, ×20, 200 µm) at perivascular and interstitial area. Quantification of αSMA-positive perivascular (B) and interstitial (C) area. Group sizes: vehicle (n = 8), AngII (n = 8), vehicle+IGF-1 (n = 8), AngII+IGF-1 (n = 7). Western blot analysis and the densitometric ratio of αSMA (D), ROCK1 (E), and ROCK2 (F). Group sizes: vehicle (n = 8–9), AngII (n = 12–13), vehicle+IGF-1 (n = 8), AngII+IGF-1 (n = 13). mRNA quantification of collagen I (G), collagen III (H), Tgfβ1 (I), Tgfβ2 (J), and Tgfβ3 (K). Results were normalized to 18 S, and mRNA levels in vehicle were arbitrarily set as 1. Group sizes: vehicle (n = 5), AngII (n = 7), vehicle+IGF-1 (n = 5), AngII+IGF-1 (n = 7). Data are presented as the mean ± SEM. *P < 0.05; **P < 0.01; ***P < 0.001; ****P < 0.0001.

