Figure 2.
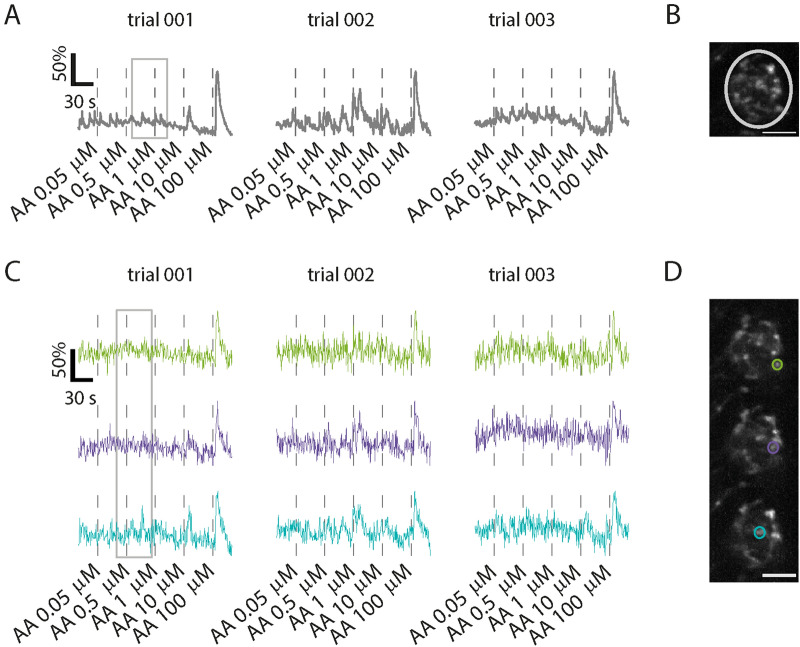
Calcium-related fluorescence over trials and between intraglomerular regions of interest. (A) Glomerular activity traces from the region of interest (ROI) shown in B. The following AA-concentrations are used: 0.05 µM, 0.5 µM, 1 µM, 10 µM and 100 µM. The traces reveal fluctuation over trials (imaging rate: 1.91 stacks/s). In this example, fluctuations are most apparent after AA concentrations in the lower micromolar range (< 10 µM). (B) Maximum projection in z and time of an exemplary glomerulus. The white circle represents a ROI that covers the whole glomerulus. Scale bar 10 µm. (C) Three consecutive trials under AA stimulation (imaging rate: 1.91 stacks/s). The colors used for the traces correspond to the colors of the ROIs shown in (D). The gray rectangle points out an exemplary time window in which variations between traces are observed. The cyan trace contains a peak within this time window that is mostly absent in the green and purple traces. (D) Three consecutive z-planes and intraglomerular example ROIs. Scale bar: 10 µm. AA a mixture of l-alanine, l-arginine, l-cysteine, l-glycine, l-histidine, l-isoleucine, l-leucine, l-lysine, l-methionine, l-phenylalanine, l-proline, l-serine, l-threonine, l-tryptophan, l-valine. Matlab and Adobe Illustrator were used for composition of this figure (see “Methods” for further details about the used software).

