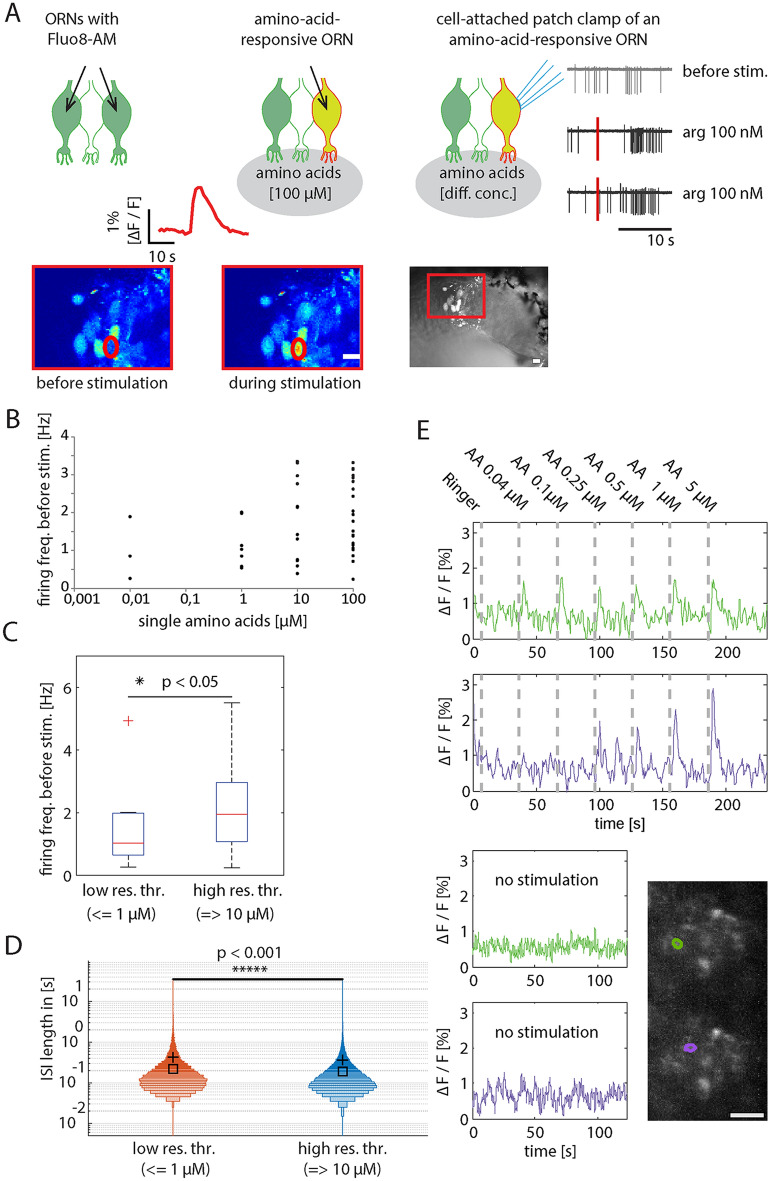
Figure 7.
Heterogeneity found among activity patterns of amino-acid responsive ORNs, indicate distinct dynamic ranges within individual glomeruli. (A) Selection of amino-acid-responsive ORNs for cell-attached patch clamp recordings. At the level of the epithelium, ORNs are temporarily stained with the calcium indicator Fluo8-AM (left). Similar to the calcium-imaging recordings from glomeruli, amino acids are administered just before the olfactory epithelium (middle). Calcium imaging of ORN somata is performed to locate amino-acid-responsive ORNs (red circle, left and middle). A bright field image is used to guide the patch-pipette to one of the amino-acid-responsive ORNs (right image). Exemplary patch-clamp recordings (traces on the right), showing an example of spontaneous activity and two examples of an l-arginine-induced response in the same ORN. (B) ORNs (single dots) sorted based on their response thresholds to single amino acids [l-arginine, l-histidine, l-lysine, l-methionine, l-leucine, l-alanine, l-tryptophan, or l-phenylalanine, (x-axis)] and their spontaneous firing rates (y-axis). EC-50 was calculated to be 8.8 µM. (C) Using the EC-50 value (8.8 µM) for testing a relationship between ORNs sensitivity and their firing rates (Mann–Whitney-U-test: p = 0.016). ORNs with a low response threshold (n = 11) are responsive to amino acid concentrations of < = 1 µM. ORNs with a high response threshold (n = 35) are responsive to amino acid concentrations of = > 10 µM. (D) Distribution of ISI length of ORNs 30 s prior to the application of either stimulus solution to stimulation with either single amino acids (l-histidine, l-arginine, l-methionine) or Ringer’s solution (negative control). 9 ORNs with had a low response threshold (n = 13,440 ISIs; first response to stimulus concentrations below 1 of < = 1 µM) and 49 ORNs had a high response threshold (n = 48,711 ISIs; first response to stimulus concentrations above 1 µM). The black cross displays the mean. The median is depicted as a black square. The histogram width is normalized to the maximum bin count of the belonging distribution. The bin size is 0.01 s. The y-axis is logarithmic and displays the ISI length in seconds [s]. The x-axis is categorical. p < 0.001 using the Wilcoxon rank sum test. (E) Example intraglomerular regions (left, in green and magenta) with distinct dynamic ranges (middle) and spontaneous activities (right). All scale bars: 10 µm. AA a mixture of l-alanine, l-arginine, l-cysteine, glycine, l-histidine, l-isoleucine, l-leucine, l-lysine, l-methionine, l-phenylalanine, l-proline, l-serine, l-threonine, l-tryptophan, l-valine. Matlab and Adobe Illustrator were used for composition of this figure (see “Methods” for further details about the used software).

