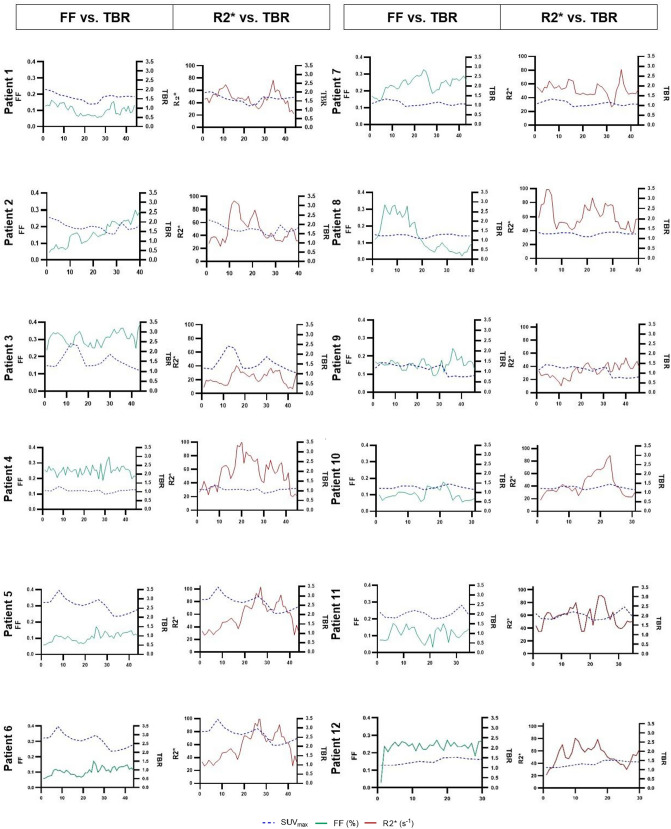
Figure 4.
Slice by slice comparison throughout the plaques of target-to-blood pool ratio versus fat fraction and intraplaque hemorrhage. The left panels in the columns show FF and TBR per MRI slice, the right panels R2* and TBR per MRI slice. TBR values are shown on the right y-axis in the figures. The slice numbers are shown on the x- axis, slice numbers differ, as plaque length varies between the patients. The comparison of the 12 patients shows a large heterogeneity in both FF and R2* dispersion and no significant correlation between FF and TBR and respectively R2* and TBR. All graphs were created using GraphPad Prism version 9.0.0 for Windows, GraphPad Software, San Diego, California USA, www.graphpad.com. FF fat fraction, TBR target-to-blood pool ratio.

