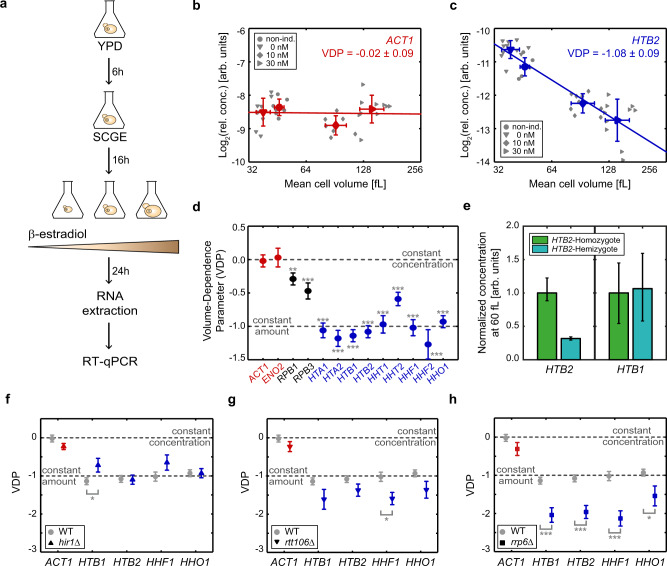
Fig. 2. Histone mRNA concentrations decrease with cell volume and increase with gene copy number.
a Experimental procedure for RT-qPCR measurements. Cells were grown for at least 24 h at the respective β-estradiol concentration before extracting total RNA and performing RT-qPCR. b, c Relative ACT1 (b) or HTB2 (c) mRNA concentrations (normalized on RDN18) for non-inducible and inducible haploid cells over mean cell volume are shown in a double-logarithmic plot. Individual data points for the different conditions (down-pointing triangles for 0 nM, circles for non-inducible, diamonds for 10 nM, right-pointing triangles for 30 nM) are shown in gray. Red (b) or blue (c) symbols indicate the mean of the different conditions with error bars indicating the standard deviations for (b), (c) biological replicates. Lines show linear fits to the double-logarithmic data, with volume-dependence parameters (VDPs) determined as the slope of the fit. d Summary of the VDPs for all measured genes with error bars indicating the standard error (fit through , , , , , , , , , , , , and biological replicates); significance that the VDP is different from 0 was tested using linear regressions: **, ***, *** ***, ***, ***, *** ***, ***, ***, ***. e Median mRNA concentrations at 60 fL, estimated from the linear fit to the double-logarithmic dependence of concentration on cell volume, for HTB2 (left) and HTB1 (right) in diploid HTB2 homozygous (green, fit through biological replicates) and HTB2/htb2∆ hemizygous (teal, fit through biological replicates) strains, normalized on the respective median concentration of the HTB2-homozygote. Error bars indicate the 2.5- and 97.5-percentiles around the median concentration ratio, determined from 10000 bootstrap samples. f–h Summary of VDPs for hir1∆ (f), rtt106∆ (g), as well as rrp6∆ (h) deletion strains. Error bars indicate the standard error of the VDPs (fit through , , , , (f), , , , , (g), , , , , (h) biological replicates). Significant VDP deviation from the wild-type VDP (carrying no deletion) was tested using linear regressions; * (f), * (g), ***, ***, ***, * (h).

