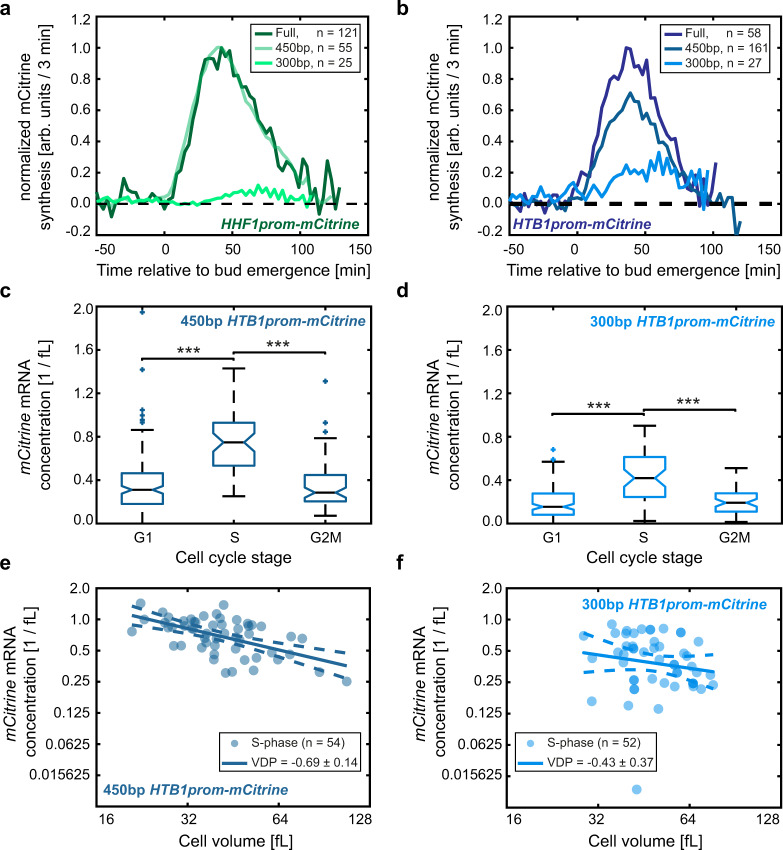
Fig. 7. Change in behavior of truncated histone promoters is not due to a disruption of the cell-cycle-dependence.
a, b mCitrine synthesis rate measured by live-cell fluorescence microscopy during the first cell cycle of new-born diploid cells, when expressed from HHF1 (a) or HTB1 (c) promoter truncations. Traces represent the mean of the moving averages over three frames of the single cell traces and are shown for the time span during which at least ten single cell traces were included in the average. All traces are aligned at the time of first bud emergence (t = 0) and normalized to the maximum mean value of mCitrine synthesis for the full promoter. c, d mCitrine mRNA concentration in G1-, S-, or G2/M-phases, estimated as the number of mRNA spots detected with smFISH in the whole cell including the bud and divided by the cell volume, measured for diploid cells expressing mCitrine from an additional 450 bp (c) or 300 bp (d) HTB1 promoter truncation. Colored boxes highlight the 25- and 75-percentiles, whiskers extend to of the distributions and colored crosses highlight outliers. Black, horizontal lines indicate the median between single cells for (c) and (d), with notches indicating the 95% confidence interval. Significances were tested using a Kruskal–Wallis test at a confidence level ; ***, *** (c), ***, *** (d). e, f mCitrine mRNA concentration in S-phase cells, expressed from an additional 450 bp (e) or 300 bp (f) HTB1 promoter truncation, shown as a function of cell volume in a double-logarithmic plot. Solid lines show linear fits to the double-logarithmic data, dashed lines represent the 95% confidence intervals of the fit. Volume-dependence parameters (VDPs) were determined as the slope of the fit, with respective standard error.

