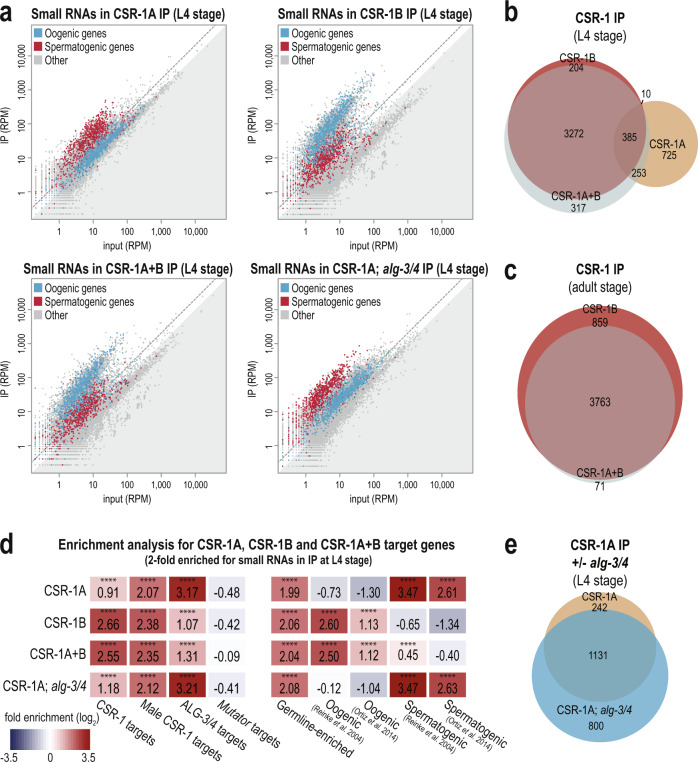
Fig. 4. CSR-1A and CSR-1B target distinct groups of genes.
a Normalized reads for oogenesis and spermatogenesis genes at L4 stage from HA::CSR-1A IP, FLAG::CSR-1B IP, FLAG::CSR-1A + B IP, and HA::CSR-1A; alg-3/4 IP compared to input. Oogenic and spermatogenic genes (defined by Reinke et al., 2004) are indicated in blue and red, respectively. Gray dotted line indicates twofold enrichment in IP relative to input. b Venn diagram indicates overlap of CSR-1A, CSR-1B, and CSR-1A + B target genes at L4 stage. Target genes are defined are at least twofold enriched in the IP, with at least 10 RPM in IP samples and a DESeq2 adjusted p value ≤0.05. c Venn diagram indicates overlap of CSR-1B and CSR-1A + B gene lists at adult stage. d Enrichment analysis (log2(fold enrichment)) examining the overlap of CSR-1A, CSR-1B, and CSR-1A + B target genes with known targets of the CSR-1, male CSR-1, ALG-3/4, and mutator small RNA pathways and oogenesis and spermatogenesis-enriched genes. See Materials and Methods for gene list information. Two-tailed p values for enrichment was calculated using the Fisher’s exact test function in R. n.s. denotes not significant and indicates a p value >0.05 and **** indicates a p value ≤0.0001. See Supplementary Data 7 for more details regarding statistical analysis. e Venn diagram indicates overlap of CSR-1A target genes in the presence or absence of alg-4; alg-3.

