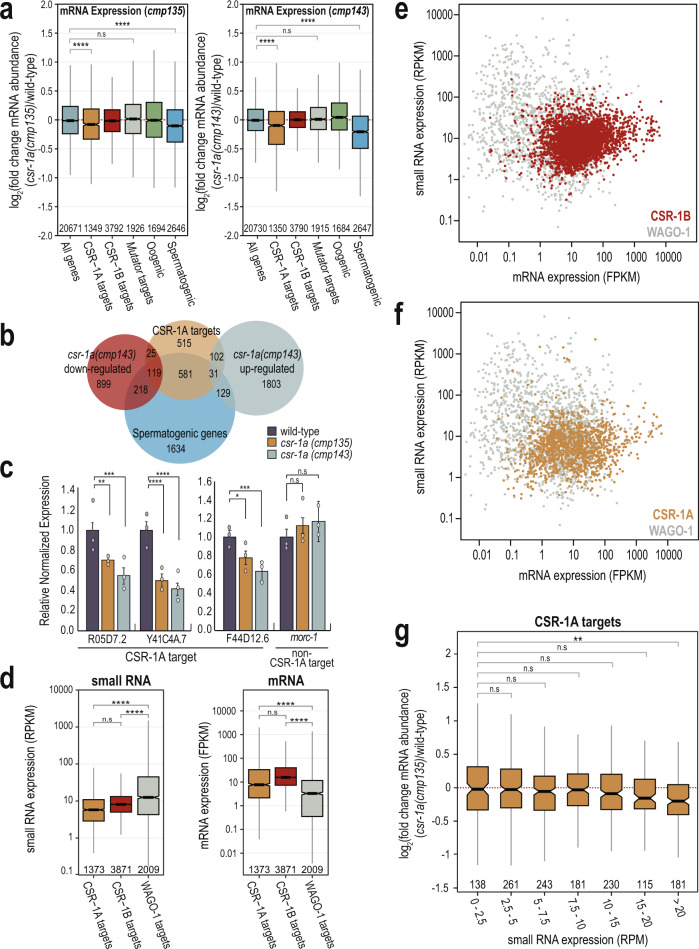
Fig. 5. CSR-1A targets spermatogenesis-expressed genes.
a Box plots depicting log2(fold change mRNA abundance) for L4 stage csr-1a(cmp135) (left) and csr-1a(cmp143) (right) mutants relative to wild-type animals at 20 °C (three biological replicates). Gene lists defined by Ortiz et al., 2014, Manage et al., 2020, and this work. b Venn diagram indicates overlap of CSR-1A targets, spermatogenic genes (Ortiz et al., 2014), and csr-1a(cmp143) up- and downregulated genes, which were defined as having a DESeq2 adjusted p value ≤0.05. c RT-qPCR from wild-type, csr-1a (cmp135), and csr-1a (cmp143) L4 animals raised at 20 °C for R05D7.2, Y41C4A.7, and F44D12.6, genes that are highly enriched in HA::CSR-1A IPs, and morc-1, which is enriched in FLAG::CSR-1B and FLAG::CSR-1A + B IPs, but not HA::CSR-1A IPs. Relative expression was normalized over rpl-32 and calculated relative to wild-type animals. Bar graphs representing mean for three biological replicates and error bars indicate SEM. d Box plot depicting small RNA reads per kilobase per million (RPKM, left) and mRNA fragments per kilobase per million (FPKM, right) from L4 wild-type animals, raised at 20 °C, 48 h post L1 (two biological replicates for small RNA and three biological replicates for mRNA). Small RNAs and mRNAs transcripts were grouped based on their mapping to CSR-1B, CSR-1A, and WAGO-1 target genes, identified from the RNA-IP experiments. e, f Small RNA expression (RPKM) plotted against mRNA expression (FPKM) in wild-type animals for CSR-1B (e) and CSR-1A (f) target genes compared against WAGO-1 target genes. CSR-1B, CSR-1A, and WAGO-1 gene lists come from FLAG::CSR-1B IP, HA::CSR-1A IP, and FLAG::WAGO-1 IP in L4 animals, respectively. Each point is calculated from the average of two biological replicates for small RNA and three biological replicates for mRNA. g Box plot depicting log2(fold change mRNA abundance) of CSR-1A target genes for L4 stage csr-1a(cmp135) mutants relative to wild-type animals at 20 °C where the CSR-1A target genes are binned based on the mapped small RNA reads per million (RPM) in wild-type animals (three biological replicates). For all box plots (a, d, g), bolded midline indicates median value, box indicates the first and third quartiles, and whiskers represent the most extreme data points within 1.5 times the interquartile range, excluding outliers. Two-tailed t-tests were performed to determine statistical significance (a, c, d, g) and p values were adjusted for multiple comparisons (a, d, g). n.s denotes not significant and indicates a p value >0.05, * indicates a p value ≤0.05, ** indicates a p value ≤0.01, *** indicates a p value ≤0.001, and **** indicates a p value ≤0.0001. See Supplementary Data 7 for more details regarding statistical analysis.

