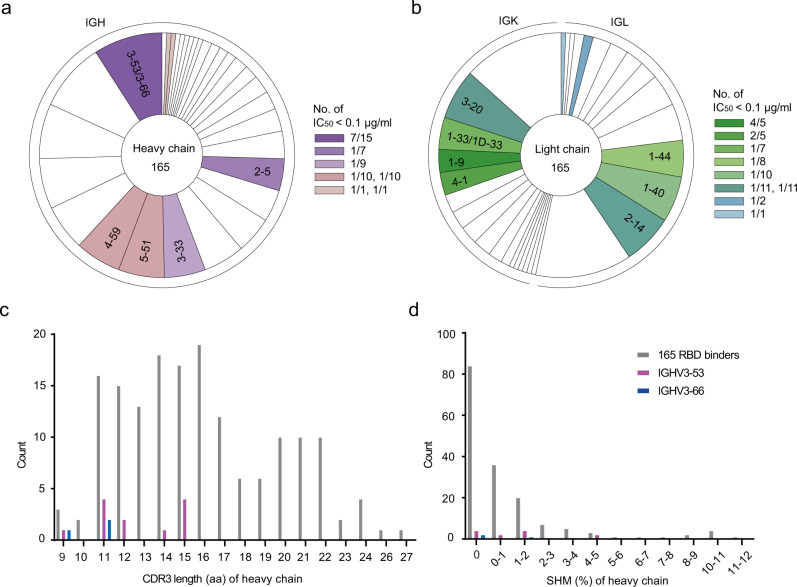
Fig. 1. Preferred usage of IGHV3-53/3-66 among the potent neutralizing antibodies.
a, b Lineage analysis for heavy and light chains in pie charts. The numbers in the center represent the number of RBD-specific antibodies. Each slice represents a unique clone and proportional to its own size. c, d Counts of various CDR3 length and somatic hypermutation from IGHV3-53 and IGHV3-66 as well as RBD binders. Source data are provided as a Source Data file.

