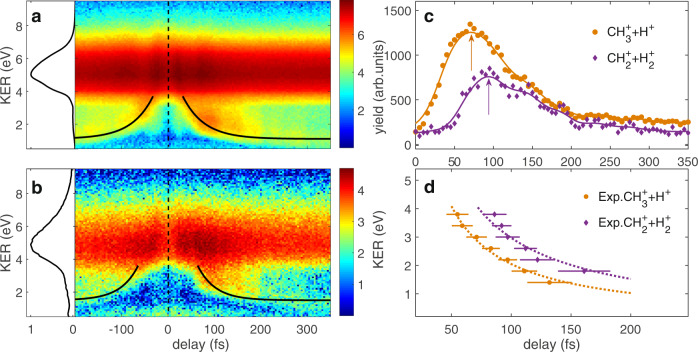
Fig. 2. Time evolution of two-body breakup channel.
The measured ion yields with respect to the KER and the pump-probe time delay for the pathways of a and b . The time-integrated KER distributions are shown in the left panels. The black solid curves in a and b are used to guide the time-dependent feature. c The measured ion yields with respect to the time delay at the KER of 3.0 eV for the pathways of and (multiplied by a factor of 5 for visual convenience). The arrows show the peaks of the time-dependent distributions. d The peak extracted from the measured time-dependent distribution for different KERs. The dotted lines are the fits of the experimental data. The error bars represent the root-square deviation between the data and the fit used to extract the peak of the time-dependent distribution for each KER.

