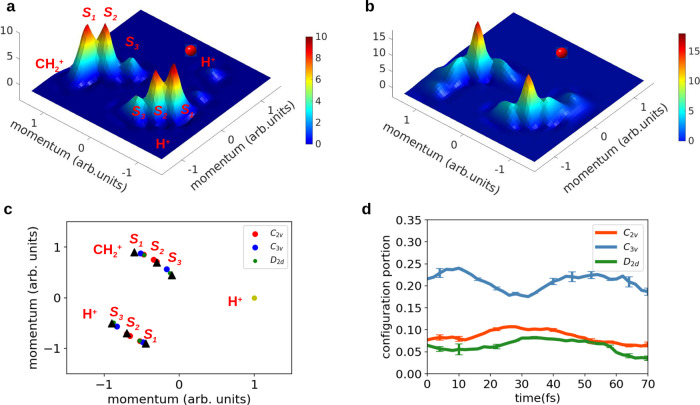
Fig. 3. Time evolution of three-body breakup channel.
Newton plot of measurement result at the delay of a 8 fs and b 28 fs. Several spot-like structures in the Newton plot are indicated by S1, S2, and S3, which include contributions of molecular geometries of different symmetry types at the instant of Coulomb explosion. The momentum of one H+ ion is set to be (1, 0). c Newton plot of C3v, C2v, D2d configurations (see Supplementary Material). d The experimentally extracted evolution of C3v-like, C2v-like and D2d-like geometries. The population of the C3v and C2v configurations peaks at 8 and 28 fs, respectively. The error bars represent the mean absolute deviation of the statistical errors.

