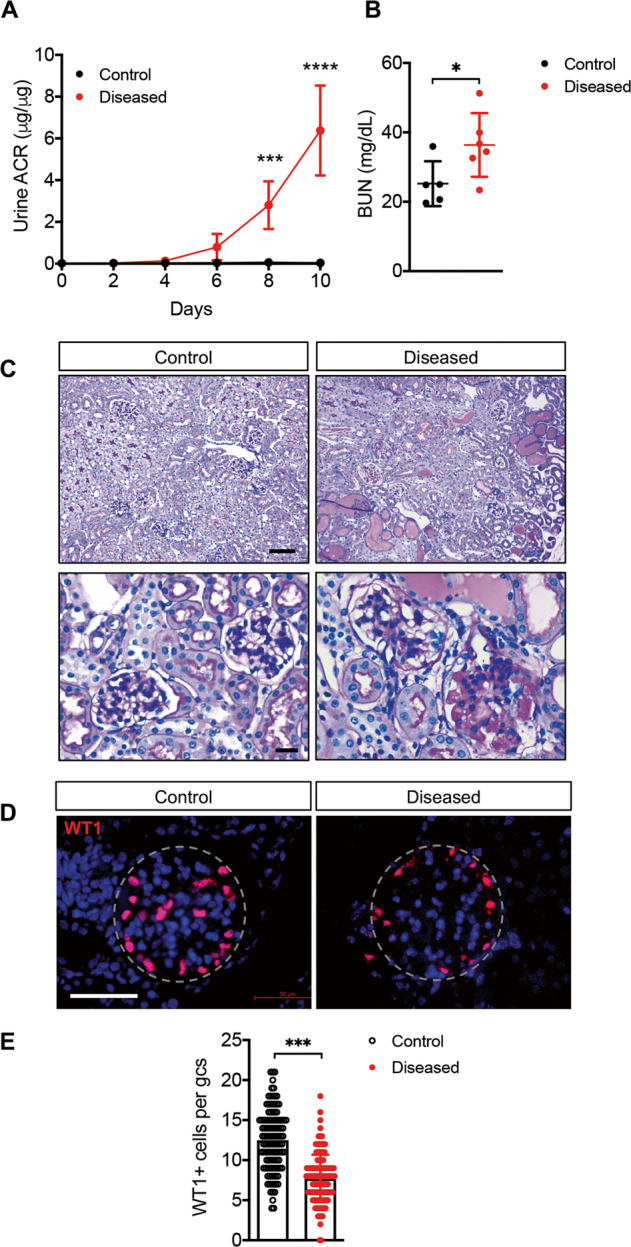
Fig. 1. DT-induced podocyte depletion in Flk1-EYFP mice.

A Urinary albumin-to-creatinine (UACR) ratio in samples collected after DT injection (n = 5–6 mice per group). ***p < 0.001 and ****p < 0.0001 when compared between groups by two-way ANOVA with Bonferroni’s correction. B Blood urea nitrogen (BUN) levels at 10 days after DT injection (n = 5 control, n = 6 diseased). *P < 0.05 between groups by unpaired two-tailed t-test with Welch’s correction. C Representative images of periodic acid–Schiff (PAS)-stained kidneys in low (top panels) and high (bottom panels) magnifications. Scale bars, 100 μm (top) and 20 μm (bottom). D Representative images of WT1 immunostaining of kidney sections. Kidney sections were counterstained with Hoechst (n = 3 mice per group; glomeruli are outlined with dotted lines). Scale bar, 50 μm. E Quantification of WT1-positive cell per glomerular cross-section (gcs) (n = 3 mice per group with at least 60 glomeruli counted per mouse). ***p < 0.001 between groups by unpaired two-tailed t-test with Welch’s correction.
