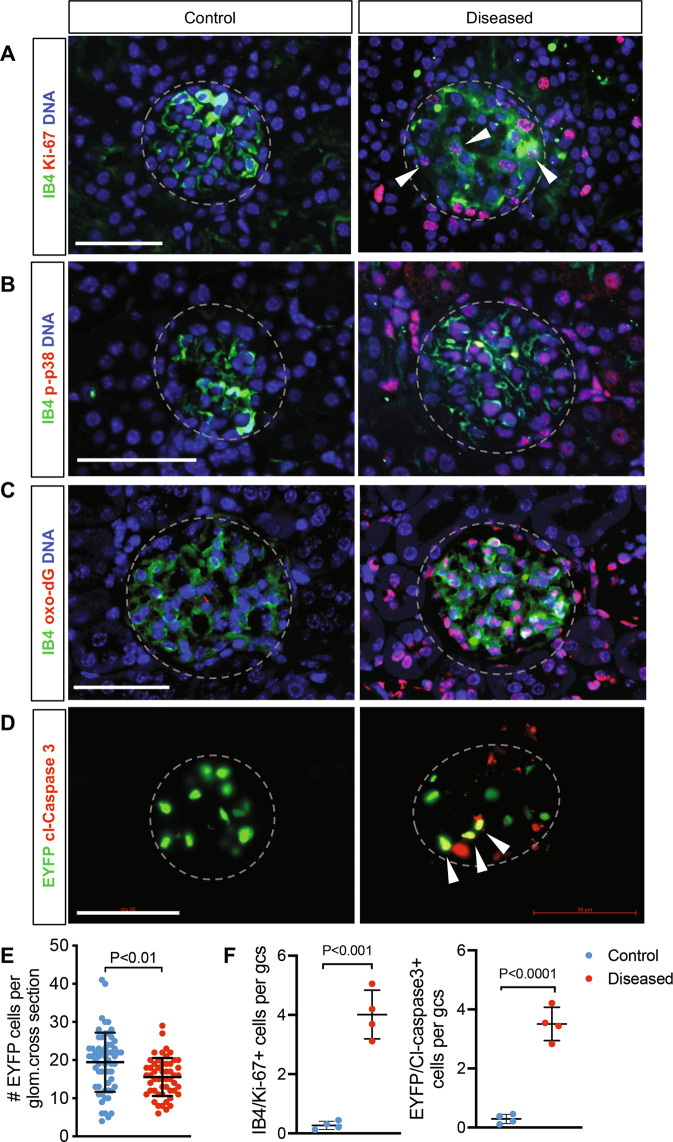
Fig. 6. Podocyte loss results in net GEC loss.
A–D Representative immunofluorescence images of control and diseased glomeruli as indicated. Glomeruli are outlined in dotted lines. Scale bars, 50 μm. DNA is counterstained in blue. A Ki-67 (red) and endothelial marker isolectin GS-IB4 (IB4, green). Arrowheads show examples of Ki-67+ and IB4+ cells. B Phospho-p38 MAPK (p-p38, red) and IB4 (green). C DNA damage marker 8-oxo-2′-deoxyguanosine (oxo-dG, red) and IB4 (green). D Cleaved Caspase 3 (cl-Caspase 3, red) and EYFP marking the GECs. Arrowheads show examples of EYFP nuclei that are cl-Caspase 3+. DNA counterstain is omitted for clarity of double-positive nuclei in yellow. E Average number of EYFP+ cells per glomerular cross-section (n = 61 glomeruli from control mice, 53 from diseased mice, quantified from three mice per experimental group). P < 0.01 between groups by unpaired two-tailed t-test with Welch’s correction. F Average number of IB4/Ki-67 double-positive cells (left) and EYFP/cl-Caspase 3 double-positive cells per glomerular cross-section (gcs) in mice (n = 4 mice per group, 20–30 glomeruli evaluated per mouse). P < 0.001 and P < 0.0001 by unpaired two-tailed t-test.

