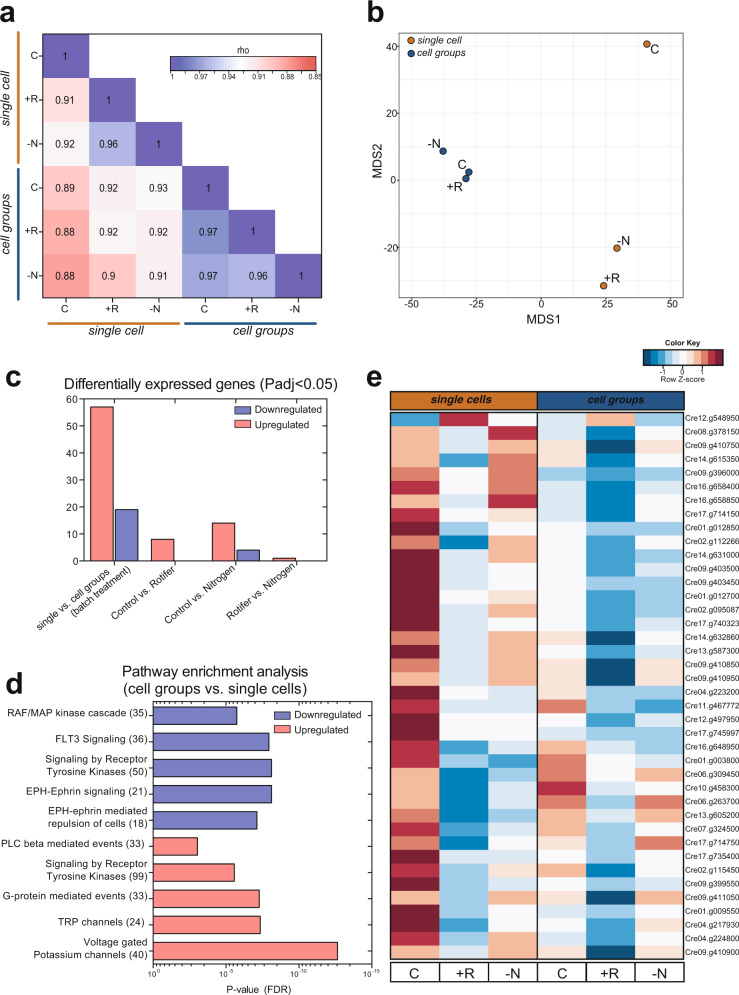
Fig. 2. Heritable transcriptome of single cells and cell groups.
a Spearman correlation plot and b MDS analysis of algal transcription profiles for single cells (red) and cell groups (blue) clones separated by control (C), rotifer predation (+R) and, low-nitrogen (-N) treatments. c Plot depicting differentially expressed genes for multiple comparisons. d Significantly enriched pathways in based on the differentially expressed genes of discovered for cell groups and e heatmap referring to the top40 differentially expressed genes between cell groups and single cell clones. Source data are provided as a Source Data file (c).

