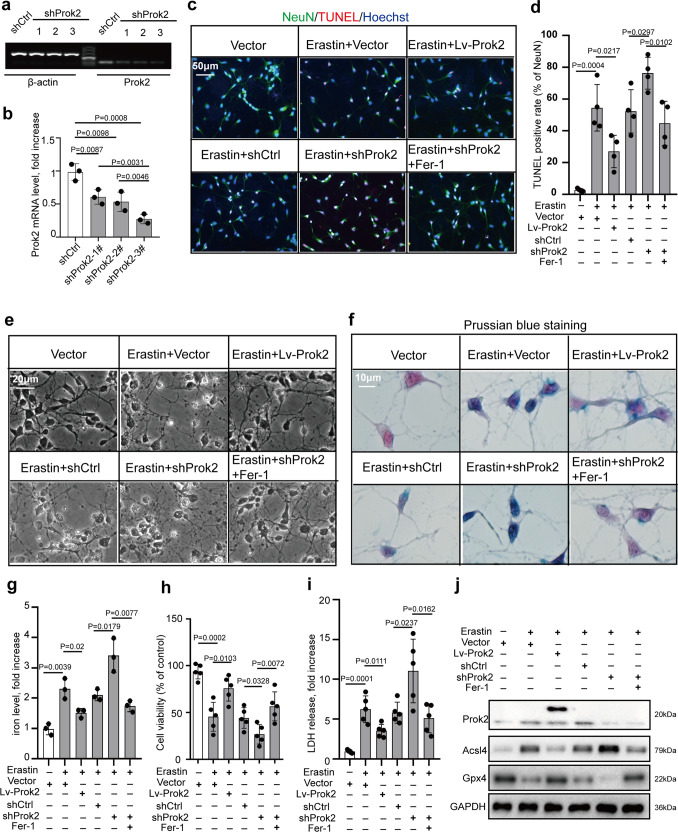
Fig. 2. Overexpression of Prok2 attenuates Erastin-induced cytotoxicity.
Primary cortical neurons are treated with 20 µM Erastin for 24 h, lentivirus containing Prok2 (Lv-Prok2) or control (vector), control RNAi (shCtrl) or RNAi against Prok2 (shProk2), and ferrostatin-1 (Fer-1). a shProk2 decreases Prok2 mRNA levels vs. shCtrl. One of the three Prok2-interfereing shRNAs, the sh-Prok2-3#, is found to decrease Prok2 mRNA expression most efficiently. b Quantification of Prok2 mRNA levels by ImageJ. Data presented as mean ± SD (n = 3 experiments). c, d Cell death measured by TUNEL staining of primary neurons. Scale bar is 50 μm. Data presented as mean±SD (n = 4 experiments). e Representative photomicrographs of primary cortical neurons in different groups. Characteristic of neuronal injury are disruption and thinning of neurites with large vacuoles and bright spots as well as decreased cytoplasm. Cellular and neurite fragments are also observed in extracellular compartment. Scale bar is 20 μm. f, g Prussian blue staining shows that Erastin stimulates the formation of Fe3+ (blue) in neurons. Lv-Prok2 suppresses this effect. Scale bar is 10 μm. The iron levels are determined based on the color intensities measured by ImageJ. Data presented as mean±SD (n = 3 independent experiments). h, i Cell viability analyzed by CCK-8. Cytotoxicity induced by Erastin is measured by LDH assay. Data presented as mean ± SD (n = 5 experiments). j Expression of Prok2, Gpx4 and Acsl4 in primary neurons under various treatment conditions. GAPDH is used as control in western blot assays. For all panels, n indicates biologically independent repeats. P value was determined by two-tailed unpaired Student’s t test for comparations between two groups. Source data are provided as a Source Data file.

