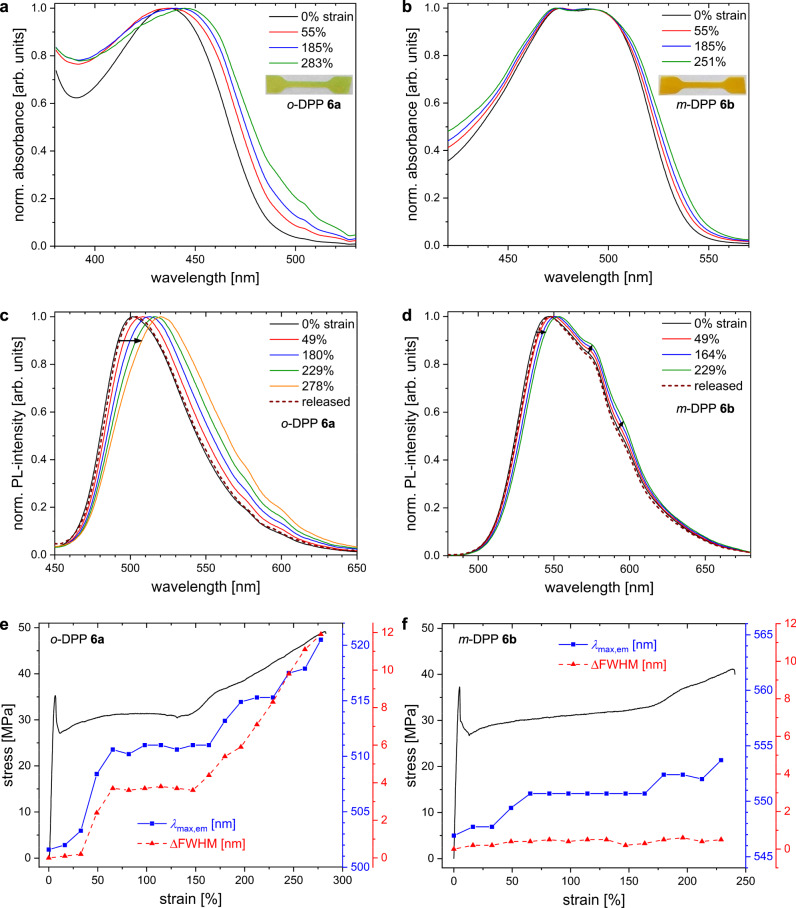
Fig. 5. Combination of tensile testing and in-situ optical characterization of thin films.
Left column: o-DPP 6a; right column: m-DPP 6b. a, b UV-vis absorption spectra measured during/after stress-strain experiments and (c, d) the corresponding emission spectra. e, f Stress-strain curves (black) together with the detected emission maxima λmax,em (blue) and the changes in Full Width at Half Maximum of the emission bands (ΔFWHM, red). Strain values as percentage elongation with respect to initial specimen length.

