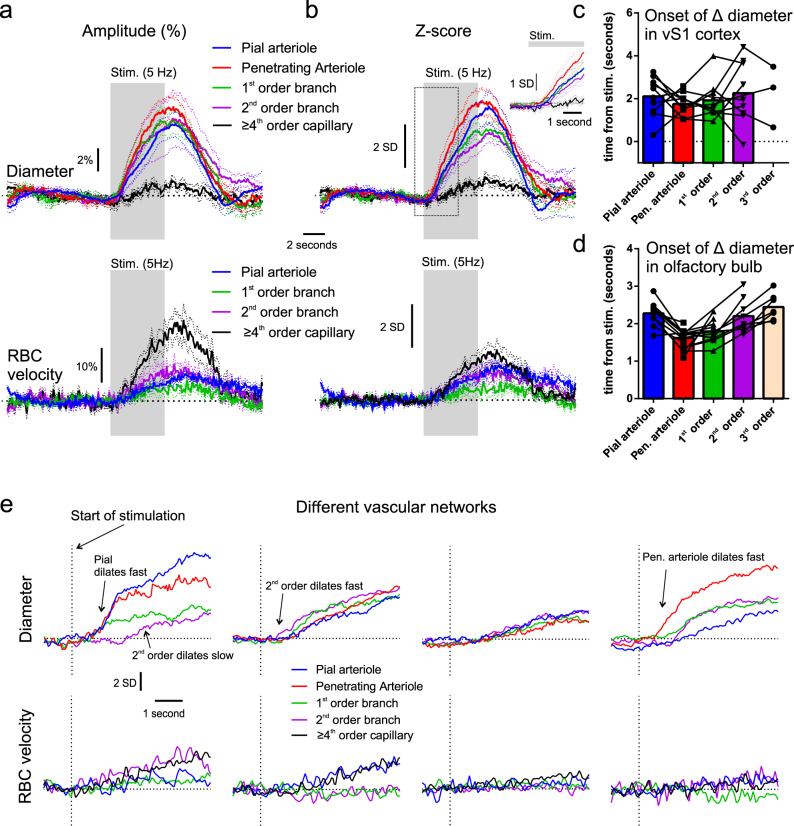
Fig. 2. Diversity of functional hyperemia onset times across the vascular arbor of vS1.
a Average changes in diameter (top) and RBC velocity (bottom) of different vascular compartments in percent increase from baseline. b Average z-score changes in diameter (top) and RBC velocity (bottom) of different vascular compartments. Dotted lines in a and b represent SEM. Dotted line box outlines zoomed-in inset in the top right corner. c Histogram of onset times (25% of fit peak) across different compartments in vS1 cortex. Data in a–c represent 10 vascular networks from 6 mice. d Histogram of onset times (25% of fit peak) across different compartments in OB, made on a data set primarily formed from previously published experiments1. Symbols in c and d represent data points from individual experiments. e Examples of the timing of diameter and velocity increases (z-score), from 4 different vascular networks.

