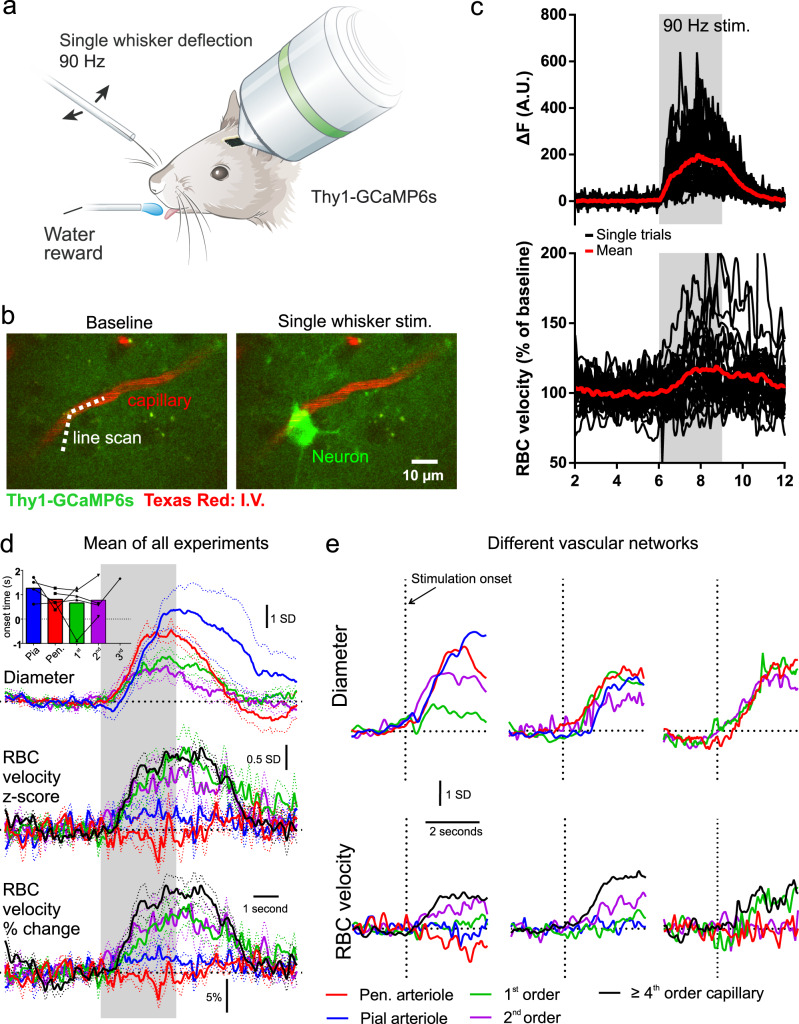
Fig. 3. Single whisker evoked vascular dynamics in awake mice.
a Schematic of experimental setup, single whisker threaded into a capillary tube and deflected at 90 Hz. Modified from ref. 51. b Example images showing increase in neuronal Ca2+ following stimulation adjacent to a capillary labeled with intravenous Texas Red-dextran. c Single trials (black) and mean (red) response of neuronal Ca2+ (top), and capillary RBC velocity (bottom) to single whisker stim. Data were acquired by scanning along the line path shown in b (dotted line) and the portion outside the vessel used to record the Ca2+ signal. d Average z-score changes in diameter (top), RBC velocity (middle) and average % changes in RBC velocity (bottom) across different compartments. Dotted lines represent SEM. Data from 6 whisker/vascular arbor pairs in 4 mice (not all compartments recorded in each network). Inset shows a histogram of onset times (25% of fit peak) across different compartments. e Examples of timing of diameter and velocity increases (z-score), from 3 different vascular networks.

