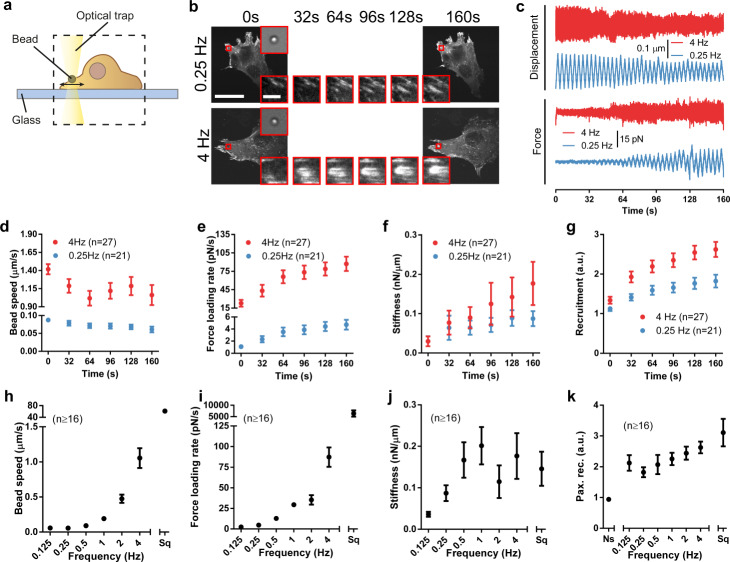
Fig. 3. The loading rate of force application to single adhesions drives their maturation.
a Illustration of the optical tweezer setup. b Images of cells transfected with GFP-paxillin during force application with triangular signals at 0.25 and 4 Hz, shown as a function of time. The area circled in red indicates the position of the stimulated bead, which is shown magnified at the top-right corner (brightfield image) and bottom-right corner (GFP-paxillin image). Magnified GFP-paxillin images are shown at different timepoints. c Example traces of displacement and forces for beads stimulated at 4 and 0.25 Hz. d–g Bead speed (d), force loading rate (e), stiffness (f), and recruitment of GFP-paxillin at beads (g) as a function of time for beads stimulated at 4 Hz and 0.25 Hz. h–k Bead speed (h), force loading rate (i), stiffness (j), and recruitment of GFP-paxillin at beads (k) for beads at the end of the experiment (160 s) for all conditions. The effects of frequency on both stiffness and paxillin recruitment were significant (p = 0.002 and 0.008, respectively). Ns non-stimulated beads, Sq stimulation with a 1 Hz square signal. n numbers are beads in all panels. Statistical significance was assessed with Kruskal–Wallis test. Scale bar is 50 µm, and 5 µm in magnifications. Data are shown as mean ± s.e.m.

