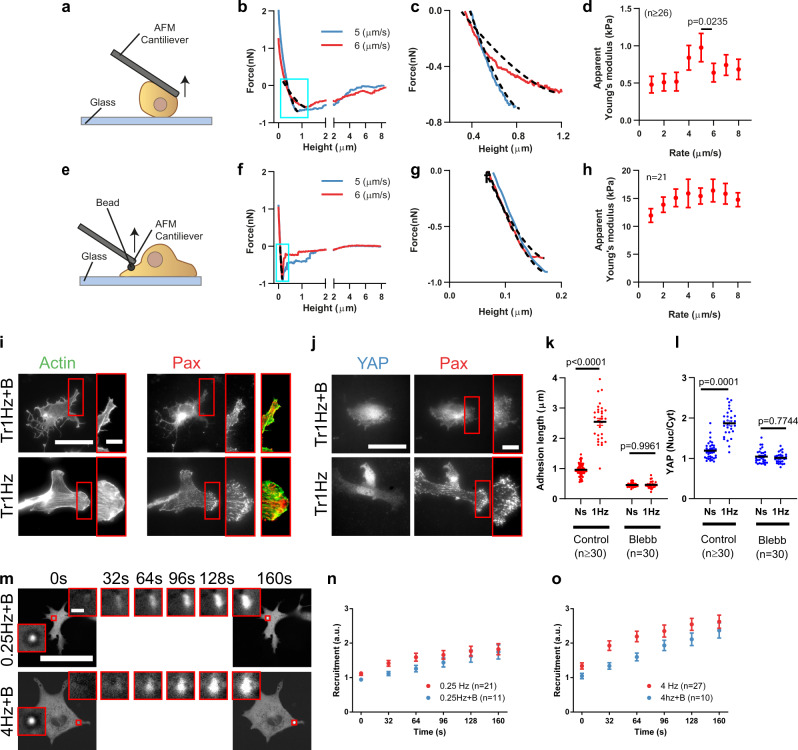
Fig. 4. High deformation rates lead to cytoskeletal softening.
a Illustration of the single-cell AFM setup. b Example cantilever retraction curves of the single-cell AFM experiments. Dashed lines within blue squares show the fits of the force/deformation curves used to calculate apparent cell stiffness (Young’s modulus). Curves were fitted between the beginning of cell stretch (below zero force) and the point at which cells start detaching (minimum force in the curve). c Magnification of the curve section fitted in b. d Stiffness as a function of the retraction speed for cells attaching to a fibronectin-coated substrate. The effect of retraction speed (p < 0.0001), and the specific decrease from 5 to 6 µm/s (p = 0.0235) were significant. n numbers are curves. Statistical significance was assessed with Friedman test. e Illustration of the bead AFM setup. f Example cantilever retraction curves of bead AFM experiments. g Magnification of the curve section fitted in f. h Stiffness as a function of the retraction speed for fibronectin-coated beads attaching to cells. The effect of retraction speed was not significant (Friedman test). n numbers are curves. i, j Actin and paxillin (i) and YAP and paxillin (j) stainings for cells stretched by 10% with a triangular 1 Hz signal, with or without blebbistatin treatment. Scale bar is 50 µm (10 µm in magnifications). k, l Corresponding quantifications of adhesion length (k) and YAP nuclear to cytosolic ratios (l). n numbers are cells. Statistical significance was assessed with two-way ANOVA. m Images of blebbistatin-treated cells transfected with GFP-paxillin during force application with triangular signals at 0.25 and 4 Hz, shown as a function of time. Areas circled in red are shown magnified at different timepoints. Scale bar is 50 µm (2 µm in magnifications). n, o Corresponding quantifications of recruitment of GFP-paxillin at beads at 0.25 Hz (n) and 4 Hz (o). No significant effect of blebbistatin was observed (two-way ANOVA). n numbers are beads. Data are shown as mean ± s.e.m.

