
Figure 2.
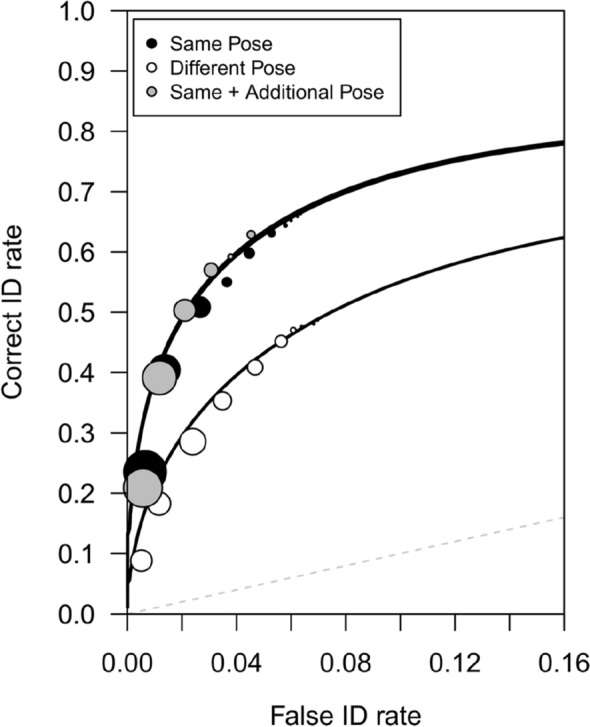
Experiment 1 ROC data in the same pose, different pose, and same + additional pose conditions. The circles are the empirical data and the curved lines of best fit were generated using the Independent Observations model. The bottom x-axis shows the estimated false ID rate of innocent suspects. The dashed line indicates chance-level performance. The size of the symbols represents the number of suspect IDs at a given level of confidence relative to the total number of suspect IDs collapsed across all levels of confidence31.