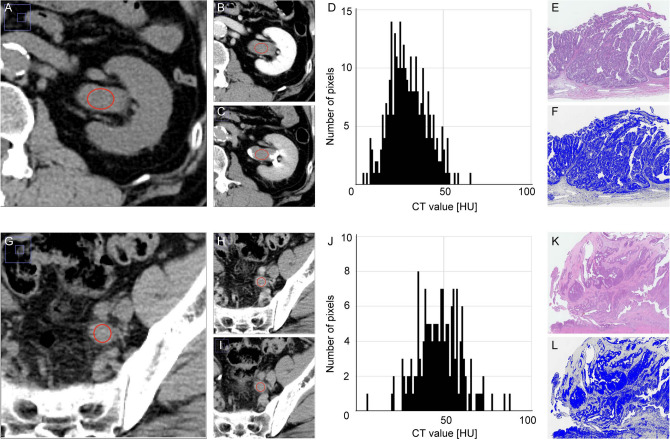
Figure 1.
Illustration of ROIs and corresponding histological findings in representative cases of non-muscle invasive UTUC and muscle invasive UTUC. (A–C) In non-muscle invasive UTUC, unenhanced (A), nephrogenic (B) and excretory (C) images are shown synchronically to detect tumor in the renal pelvis, and the ROI (red oval) was determined. (D) The histogram of CT value in HU in the tumor revealed a shape with almost a single peak. (E) Hematoxylin and eosin staining showed typical non-invasive papillary urothelial carcinoma. (F) Image analysis to estimate the amount of stromal components in tumor tissue using Image J software. An appropriate threshold was drawn to distinguish tumor cells and stromal components. (G–I) In muscle invasive UTUC, the ROI was determined with unenhanced (G), nephrogenic (H) and excretory (I) images. (J) The histogram revealed a shape with a broad base and multiple peaks. (K) Hematoxylin and eosin staining showed muscle invasive urothelial carcinoma. (L) Image analysis using Image J software. ROI = region of interest, UTUC = upper tract urothelial carcinoma, CT = computed tomography, HU = Hounsfield unit, SD = standard deviation, TA = texture analysis.

