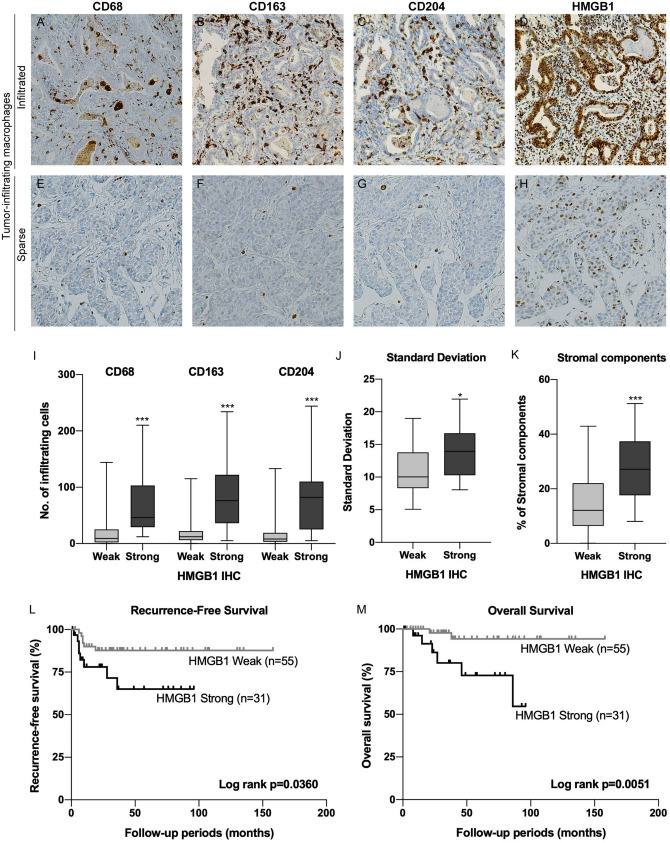
Figure 5.
HMGB1 expression was associated with tumor heterogeneity and macrophage infiltration in UTUC. Representative cases of UTUC with abundant macrophage (A–D) and sparse macrophage infiltration (E–H). The tumor with more infiltrating CD68- (A), CD163- (B) and CD204- (C) positive macrophages showed strong HMGB1 expression (D). Conversely, the tumor with fewer CD68- (E), CD163- (F) and CD204- (G) positive macrophages showed weak HMGB1 expression (H). (I) Boxplots for CD68-, CD163- and CD204-positive macrophages according to HMGB1 expression. (J) Boxplot for SD according to HMGB1 expression. (K) Boxplot for the amount of stromal components according to HMGB1 expression. (L) Kaplan–Meier analysis for RFS according to HMGB1 expression. (M) Kaplan–Meier analysis for OS according to HMGB1 expression. *p < 0.05, ***p < 0.0001. HMGB1 = high mobility group box 1, UTUC = upper tract urothelial carcinoma, SD = standard deviation, RFS = recurrence-free survival, OS = overall survival.

