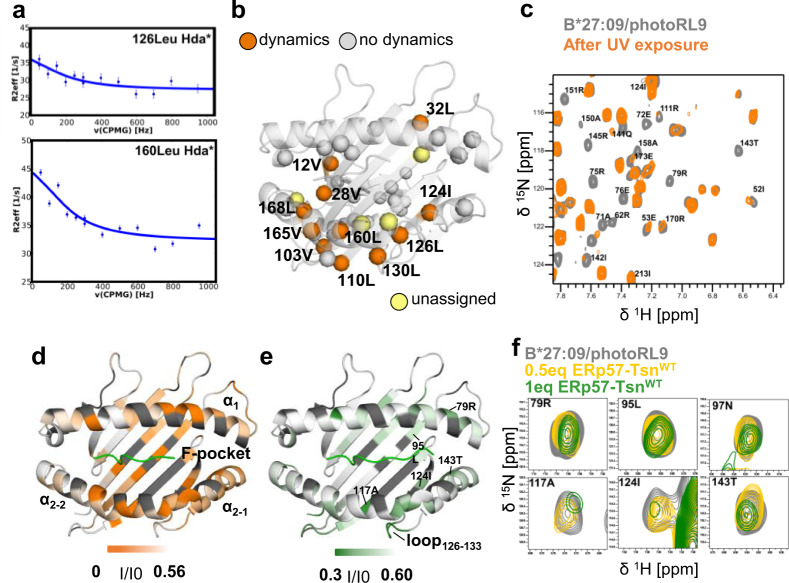
Fig. 1. Tapasin “loosens” C-terminus of bound peptide in the pMHC-I.
a Representative relaxation dispersion curves of B*27:09/photoRL9 methyl groups undergoing conformational exchange (> 2 s−1) in 1H-13C methyl-CPMG experiments recorded at 27 °C at a 1H field of 700 MHz. The effective transverse relaxation rate () is shown as a function of the CPMG pulse frequency (νCPMG) for selected methyl groups. Errors were estimated based on duplicate measurements. b Residues showing μs-ms dynamics derived from methyl-CPMG experiments of B27:09/photoRL9 (170 μM) are highlighted as orange spheres in the structure of B*27:09. Other assigned ILV methyl residues which did not show dynamics are mapped as gray spheres. Unassigned residues are shown in light yellow. c Zoom view of 1H-15N TROSY-HSQC spectra of B*27:09/photoRL9 before (gray) and after UV exposure (orange). Peaks vanished upon UV exposure are labeled. d Peak intensity ratio (Iuv-exposed/Ino-uv) of cleaved B*27:09/photoRL9 (Iuv-exposed) relative to non-cleaved B*27:09/photoRL9 (Ino-uv) is mapped as B-factor in the structure of B*27:09 heavy chain. The range of the intensity ratio is from 0 (orange) to the average Iuv-exposed/Ino-uv (0.58, white). Unassigned residues are colored in dark gray. e Peak intensity ratio (I/I0) of B*27:09/photoRL9 in the presence of ERp57-TsnWT (I) relative to B*27:09/photoRL9 alone (I0) is mapped as B-factor in the structure of B*27:09 heavy chain. The range of the intensity ratio is from half (0.30, forest) to the average I/I0 (0.6, white). Unassigned residues are colored in dark gray. f Representative peaks of residues lining the F-pocket showing reduced signal in the presence of ERp57-TsnWT (0.5eq in yellow, 1eq in forest).

