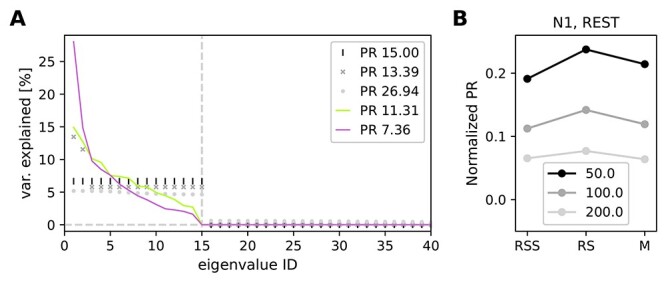
Figure 3.

Participation ratio (PR) to characterize the dimensionality. (A) Sketch showing relation between the eigenvalue spectrum and PR. If the first  out of 100 eigenvalues explain equal amounts of variance and the rest vanishes, the PR equals
  (black vertical lines for
  ). If a few eigenvalues are much higher than the others, the resulting PR decreases (dark gray crosses). If, on the contrary, a uniformly distributed random value is added to each eigenvalue from the first case, the calculated PR becomes higher (light gray circles). Experimental data are typically a mixture of the second and third case. Continuous traces show exemplary results for a single 3 s data slice of RS (green) and M (pink) in session N1. (B) PR was calculated with different bin sizes (50, 100, and 200 ms) in exemplary session N1. PR values were normalized by the number of SUs recorded in this session.
