
Figure 4.
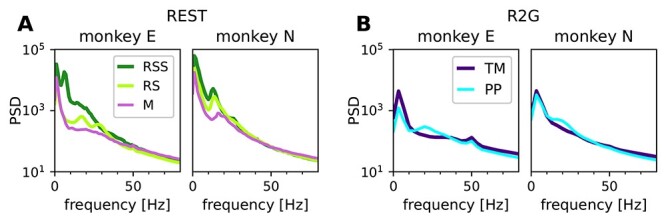
Power spectral density of LFP in different behavioral states. Panels in A pertain to REST, panels in B to R2G, left for monkey E and right for monkey N, respectively. States are defined in Figure 1A and B. The peak at 50 Hz in the R2G spectra is an artifact (line frequency) and was not considered.