
Figure 7.
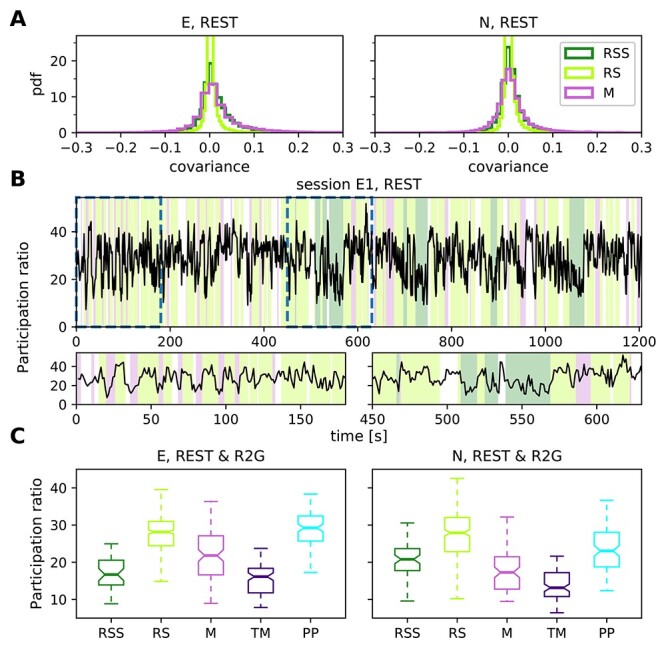
Network firing properties. (A) Distributions of pairwise COVs for the REST recordings of monkey E (left) and monkey N (right), calculated in 3 s slices with 100 ms bins, averaged over slices per SU pair and pooled over sessions. (B) Time-resolved PR in session E1, calculated in 3 s long sliding windows with an overlap of 2 s. Each value on the plot corresponds to the center of the respective window. Colors in the background indicate behavioral states (cf. legend in the right panel of A). Two bottom panels show close-up view at periods marked by dashed lines in the top panel. (C) Dimensionality: Box plots show the PR of REST (RSS, RS, M) and R2G (TM, PP) states for monkey E (left) and monkey N (right), each single value of the distributions corresponds to a single 3 s data slice. Pooled over sessions.