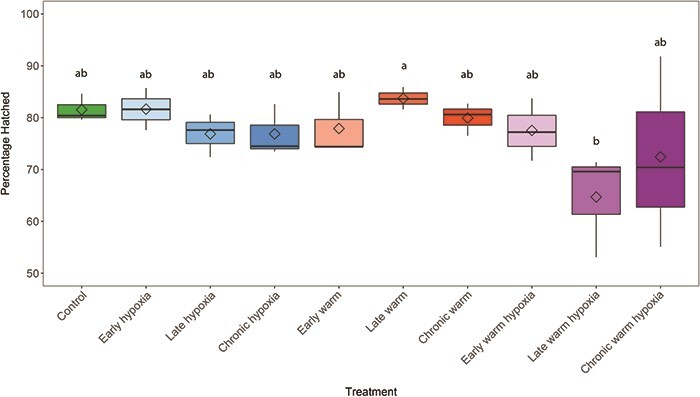
Figure 2.

Percentage of embryos hatched (n = 3 per treatment). Boxplots of the data represent the median as the centre line, interquartile range (IQR) as the box, values 1.5 times the IQR as the whiskers and values greater than 1.5 times the IQR as black points. Diamonds indicate the mean value. Colours represent the developmental treatment: control (green, 100% DO, 10°C), hypoxia (blue, 50% DO, 10°C), warm (red, 100% DO, 14°C) or warm hypoxia (purple, 50% DO, 14°C). The three boxplots within each stressor type represent the developmental timing of exposure as early (eyed stage, light colour shade), late (silver-eyed stage, medium colour shade) and chronic (fertilization through hatching, dark colour shade). Letters indicate significant differences among treatments (P < 0.05).
