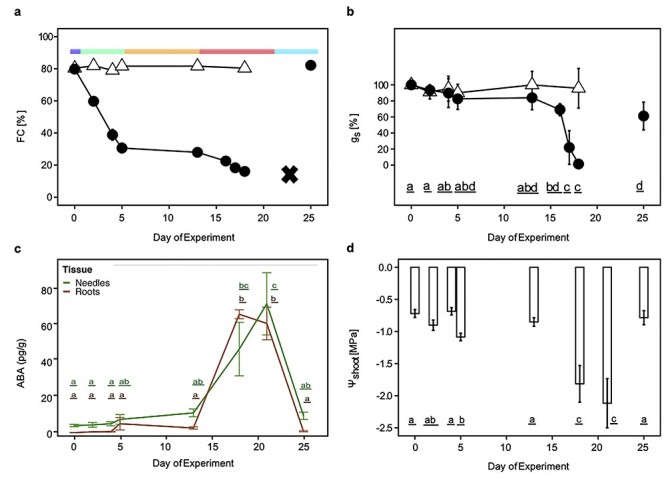
Figure 1.

Physiological response of Norway spruce seedlings to drought. Norway spruce seedlings were subjected to increasing levels of water deficit (filled circles) or kept in well-watered control conditions (clear triangles). (a) Colored bars above the plot represent the following treatment conditions: soil moisture dropped from 80% (dark blue portion of the colored bar) to 30% FC after withholding water for 5 days and was regarded as mild water deficit (green portion of the colored bar). After maintaining this condition for 7 days (orange portion of the colored bar), a more severe drought stress was induced (red portion of the colored bar), again by withholding water. After 21 days, water-stressed plants were re-irrigated (cyan portion of the colored bar) and the soil moisture levels recovered to the level of well-watered plants. Colors indicating these experimental conditions are used in subsequent figures. All plants were visually identical, with no visible effects of drought for the sampled time points. An additional set of plants (n = 5) were not re-irrigated after the severe drought stress. All needles on these plants died after 23 days, indicated by a black cross. (b) Needle stomatal conductance (gs) in control (clear triangles) and drought-stressed (filled circles) seedlings. (c) Abscisic acid levels of needles (green) and roots (brown) of drought-stressed seedlings. (d) Midday water potential (ψshoot) measured on shoots of three to five independent plants per time point in drought stress. The result of a one-way ANOVA performed on the average values of three measurements per plant is indicated. For all panels, data are means and error bars represent the ±95% CIs. Letter represent statistically significant differences (P < 0.05; Tukey’s HSD) between time points of the drought stress.
