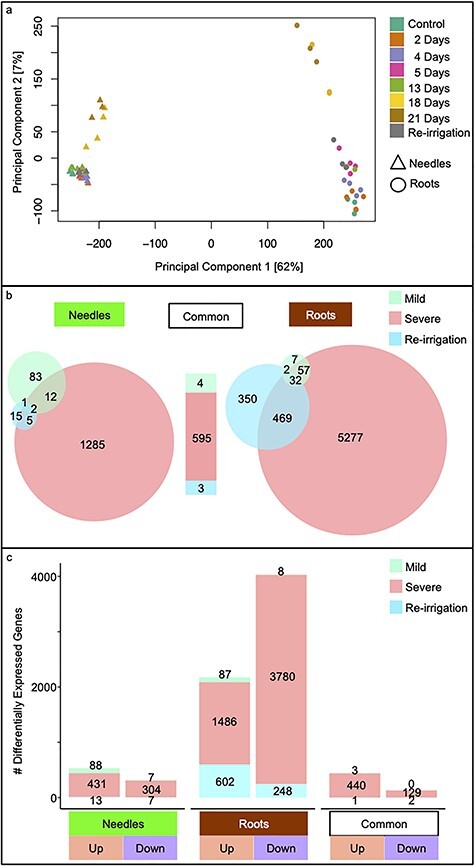
Figure 2.

Effect of drought on the transcriptomes of needles and roots in Norway spruce. Principal component analysis plot of transcriptomic data of drought-stressed needle and root (a) samples. Expression data of control, mild and severe drought-stressed seedlings and after re-irrigation were normalized using variance stabilizing transformation before ordination analysis. Three to four plants were sampled at each time point and were used for RNA-Seq. The first two components of the PCA are shown with samples colored by soil water percentage FC. (b) Venn diagrams of DEGs in needles (left) and roots (right) after comparing the mild and severe drought stages and after re-irrigation separately against well-watered expression levels. Independently, the number of DEGs and the number of these in common between the tissues are displayed separately for each stage of the treatment. Conditions are colored as in Figure 1c). Genes either up- or down-regulated in needles and roots and with the same expression in the tissues (common) are displayed in a bar graph and colored by treatment according to Figure 1.
