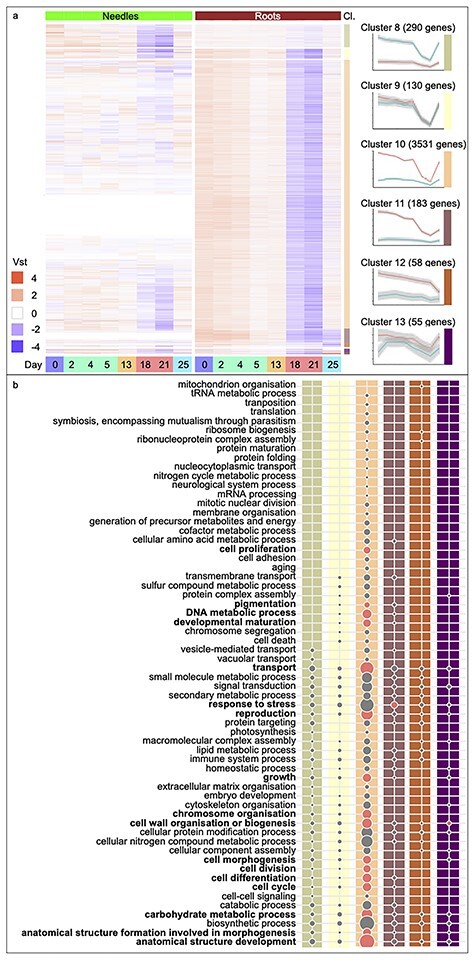
Figure 4.

Gene Ontology Slim enrichment analysis of biological processes down-regulated in response to drought stress. Heatmaps of DEGs with expression over the eight sampling time points (Days 0, 2, 4, 5, 13, 18, 21 and 25 and colored as in Figure 1), separated by tissue, needles (green) and roots (brown). (a) Down-regulated genes of needle- (Cluster 8) and root-specific (Clusters 10--12) Clusters or common between the tissues (Clusters 9 and 13). Displayed are the vst values scaled by row means. The six highly populated clusters (Cl.) are detailed on the side, and the average trend of gene expression and a 95% CI are indicated for both tissues. (b) The lower panel of the figure lists all GOSlim biological processes categories represented in the clusters shown in (a), with columns colored by cluster. Bold text indicates categories that were significantly enriched. Circle sizes are relative to the category containing the largest number of genes; ‘anatomical structure development’ (220 down-regulated genes). Circles in red represent significantly enriched categories (false discovery rate-adjusted P-value <0.05).
