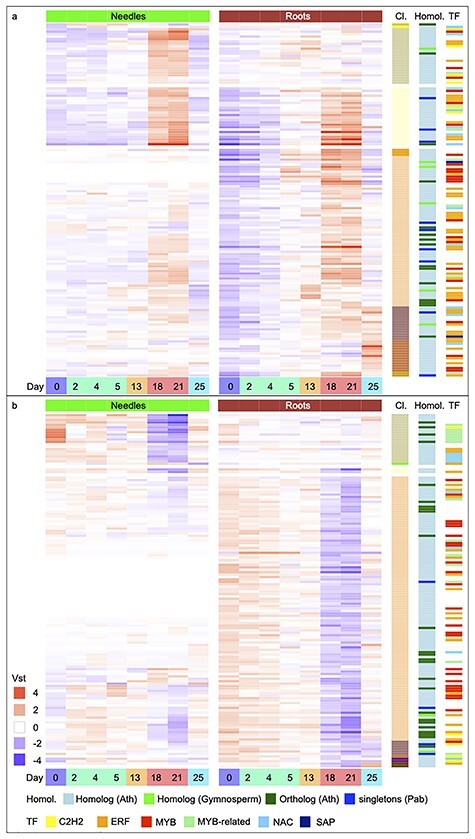
Figure 5.

Heatmap diagram of TFs differentially expressed in Norway spruce in response to drought. Displayed are the differentially expressed TFs over the eight sampling time points (Days 0, 2, 4, 5, 13, 18, 21 and 25 and colored as in Figure 1) and are separated by tissue, needles (green) and roots (brown). (a) Up-regulated TFs were clustered (Cl.) by expression and sorted by the same color coding as in Figure 3a and b). Down-regulated TFs were clustered by expression and sorted by the same color coding as in Figure 4a. Displayed are the vst values scaled by row means. In addition, information on sequence homology (Homol.) is visualized on the right side, with genes orthologous to Arabidopsis colored dark green, homologous to Arabidopsis in light blue, homologous to other gymnosperms in light green and Norway spruce-specific singletons in dark blue. Furthermore, TF families significantly enriched: ERFs, MYB-related, C2H2s and NACs in needle samples, and ERFs, MYBs and SAPs in roots are color-coded.
