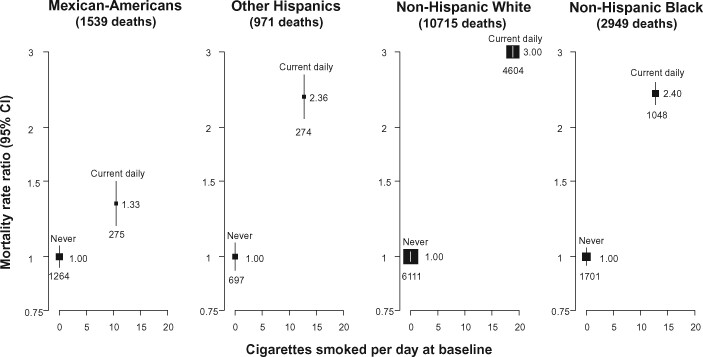
Figure 4.
US (National Health Interview Survey) relative risk of all−cause mortality by daily vs never smoking and race, ages 30−89. RR = mortality rate ratio. Analyses exclude those with previous disease at recruitment and are adjusted for age at risk, sex, region, highest education attained and alcohol consumption. The area of each plotting symbol is proportional to the amount of statistical information. Vertical lines through the symbols represent group-specific 95% confidence intervals, with the number of deaths in each category shown at the bottom of each line (categories corresponding to former smokers are not shown). Estimates are plotted against the mean number of cigarettes smoked per day at baseline

