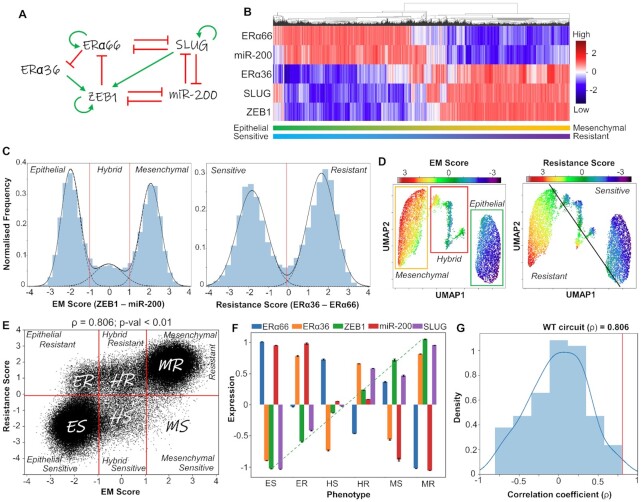
Figure 1.
Emergent dynamics of coupled EMT-ERα signaling network. (A) Gene regulatory network (GRN) showing crosstalk between EMT and Estrogen receptor (ERα) signaling. Green arrows represent activation links; red hammers represent inhibition. (B) Heatmap of stable steady-state solutions for network shown in (A), obtained via RACIPE. (C) Density histogram of EM Score ( = Zeb1 – miR-200) and Resistance Score ( = ERα36 – ERα66) fitted to 3 and 2 Gaussian distributions, respectively. Red dotted lines show segregation between phenotypes: Epithelial (E), Hybrid (H) and Mesenchymal (M) for EM score, and Resistant (R) and Sensitive (S) phenotype for the latter. (D) UMAP dimensionality reduction plots for steady-state solutions states obtained by RACIPE colored by either EM Score or Resistance score. (E) Scatter plot showing corresponding EM Score and resistance score for all RACIPE solutions, and six biological phenotypes. Spearman correlation coefficient (ρ) and corresponding P-value are reported. (F) Gene expression levels in six biologically defined phenotypes. Dotted line represents the monotonic increase in levels of ZEB1 across the phenotypes. Standard deviation is plotted as error bars. (G) Density distribution of Spearman correlation coefficients (ρ) across an ensemble of 100 randomized versions of the GRN shown in (A). Red line shows the correlation coefficient of the wild-type network shown in (A).

