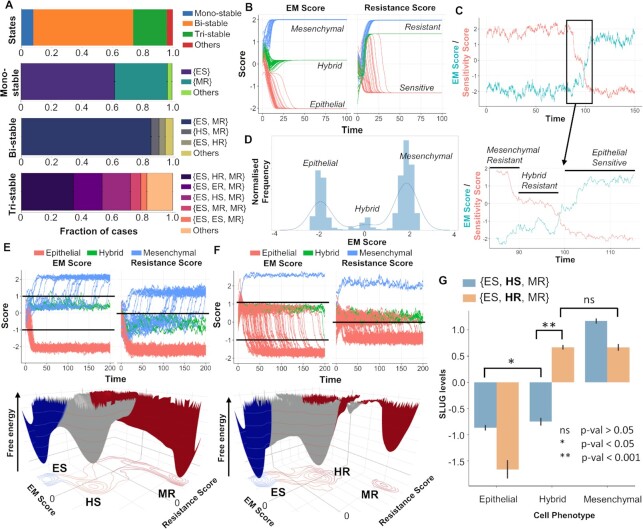
Figure 4.
Stochastic stimulations showing dynamic state transitions among different biological phenotypes. (A) Fraction of RACIPE parameter sets resulting in monostable and multistable solutions (bi-, tri-, others) and the frequency distribution of phases that compose the monostable and multistable solution sets. (B) System dynamics for a representative {ES, HR, MR} parameter set showing the existence of the three biological EM phenotypes (E, H, M) and resistant (R) and sensitive (S) phenotypes when started from multiple initial conditions. (C) Time course showing the transition of the system from a MR to an ES phenotype through a HR state under the influence of noise. Sensitivity score is defined as negative of the tamoxifen resistance score, i.e. ERα66–ERα36. (D) Marginal distribution of the EM score from the time course shown in (C); three peaks denote existence of three distinct states along EM spectrum. (E) (top) Stochastic time series for multiple initial conditions tracking EM and Resistance scores in a representative parameter set from the {ES, HS, MR} phase. (Bottom) Landscape obtained by simulation of that parameter set with valleys representing stable states possible in the system. (F) Same as (E) but for a representative parameter set from the {ES, HR, MR} phase. (G) Changes in SLUG levels as the system transitions from ES to MR phenotype through either HS or HR state. HR state is characterized by high levels of SLUG compared to HS cell state. Student’s t-test results show the level of statistical significance between various comparisons.

