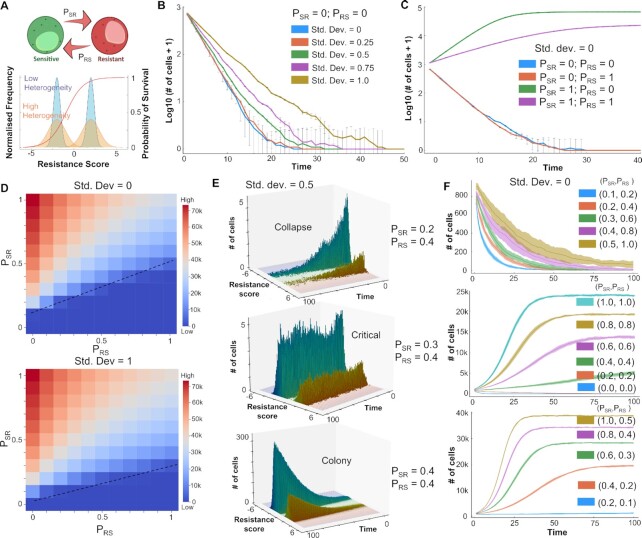
Figure 5.
Effect of heterogeneity and plasticity on tumor survival in the presence of an anti-estrogen drug. (A) Schematic for model formulation showing inter-conversions between sensitive and resistant phenotypes (transition probabilities: PSR, PRS). Heterogeneity in the cell population is modelled by standard deviation (SD) of Gaussians from which resistance scores are sampled. Survival probability of cells is a function of resistance score approximated as a sigmoidal curve (shown in red). (B) Effect of heterogeneity on population sizes over time, starting with an initially all sensitive cell population and at PSR = PRS = 0. (C) Effect of plasticity on population sizes over time starting with an initially all sensitive cell population and no heterogeneity (SD = 0). (D) Population sizes (at time [t] = 100) as a function of PSR and PRS at two different heterogeneity levels, starting with an initially all sensitive cell population. Dotted lines indicate a qualitative boundary between tumor survival and elimination scenarios. (E) Distinct qualitative scenarios—collapse of initial population of cells, maintenance of the cell population around starting initial conditions (in the time frame considered) and net growth in a population of cells leading to survival of the tumor—at varying levels of PSR and PRS. All simulations start with a fixed heterogeneity (SD = 0.5) and a fully sensitive population. (F) Population sizes over time as a function of varying values of (PSR, PRS). All simulations start with no heterogeneity (SD = 0) and a fully sensitive population. Shaded area represents the standard deviation around the mean of n=10 replicates.

