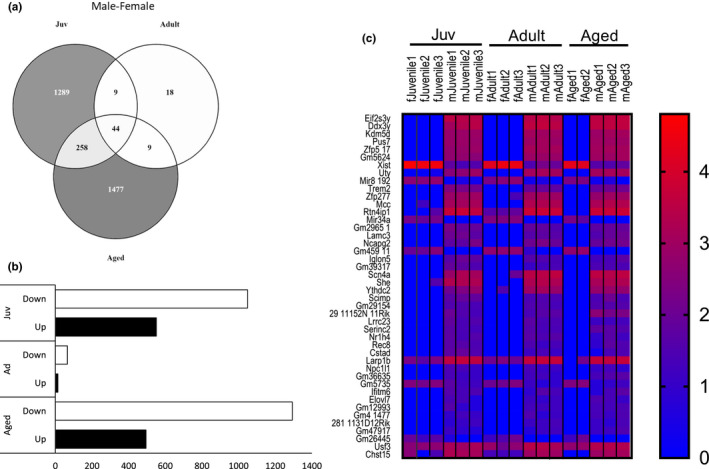
FIGURE 4.

Differentially Expressed Genes (DEGs) by sex across the life course within age. (a) Venn diagram for DEGs from sex comparisons (FDR 5%): Juv‐juvenile female compared to juvenile male as a baseline; adult, adult female compared to adult male as a baseline; aged, aged female compared to aged male as a baseline; (b) Bar graph for up‐ and downregulated DEGs from sex comparisons; Juv, juvenile female compared to juvenile male as a baseline; Ad, adult female compared to adult male as a baseline; Aged, aged female compared to aged male as a baseline. (c) Heatmap of 44 overlapping DEGs across the life course. n = 3 per group; FDR < 0.05
