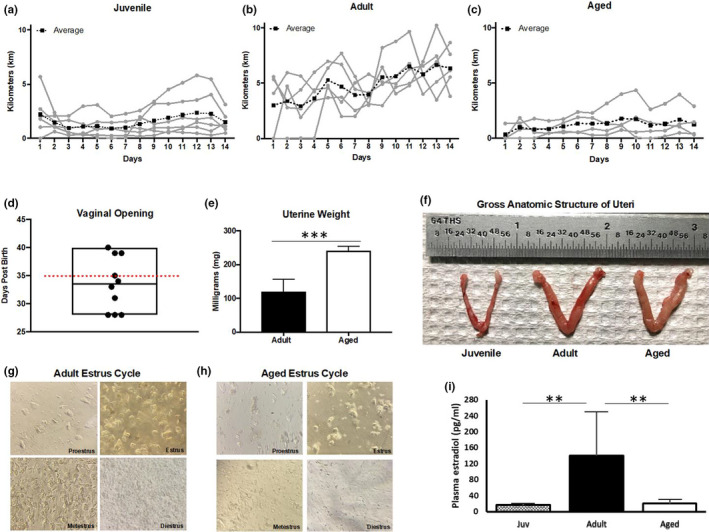
FIGURE 6.

Analysis of sexual maturity and reproductive competence in juvenile, adult, and aged female mice. (a‐c) Daily running distance for juvenile, adult, and aged female mice. Each gray line is an individual female mouse with the black dotted line representing the average (n = 6). (d) Vaginal openings for juvenile mice (n = 10), Red dotted line on day 35 post‐birth indicates the age at euthanasia; (e) Uterine weight for adult (n = 8) and aged (n = 6) mice. ***p < 0.001 by Student's t‐test; (f) Representative images of a juvenile, adult, and aged uterus; G‐H) representation of estrous cycling in adult and aged female mice; (i) female plasma estradiol levels across the life course, n = 5 per group **p < 0.01 by one‐way ANOVA
