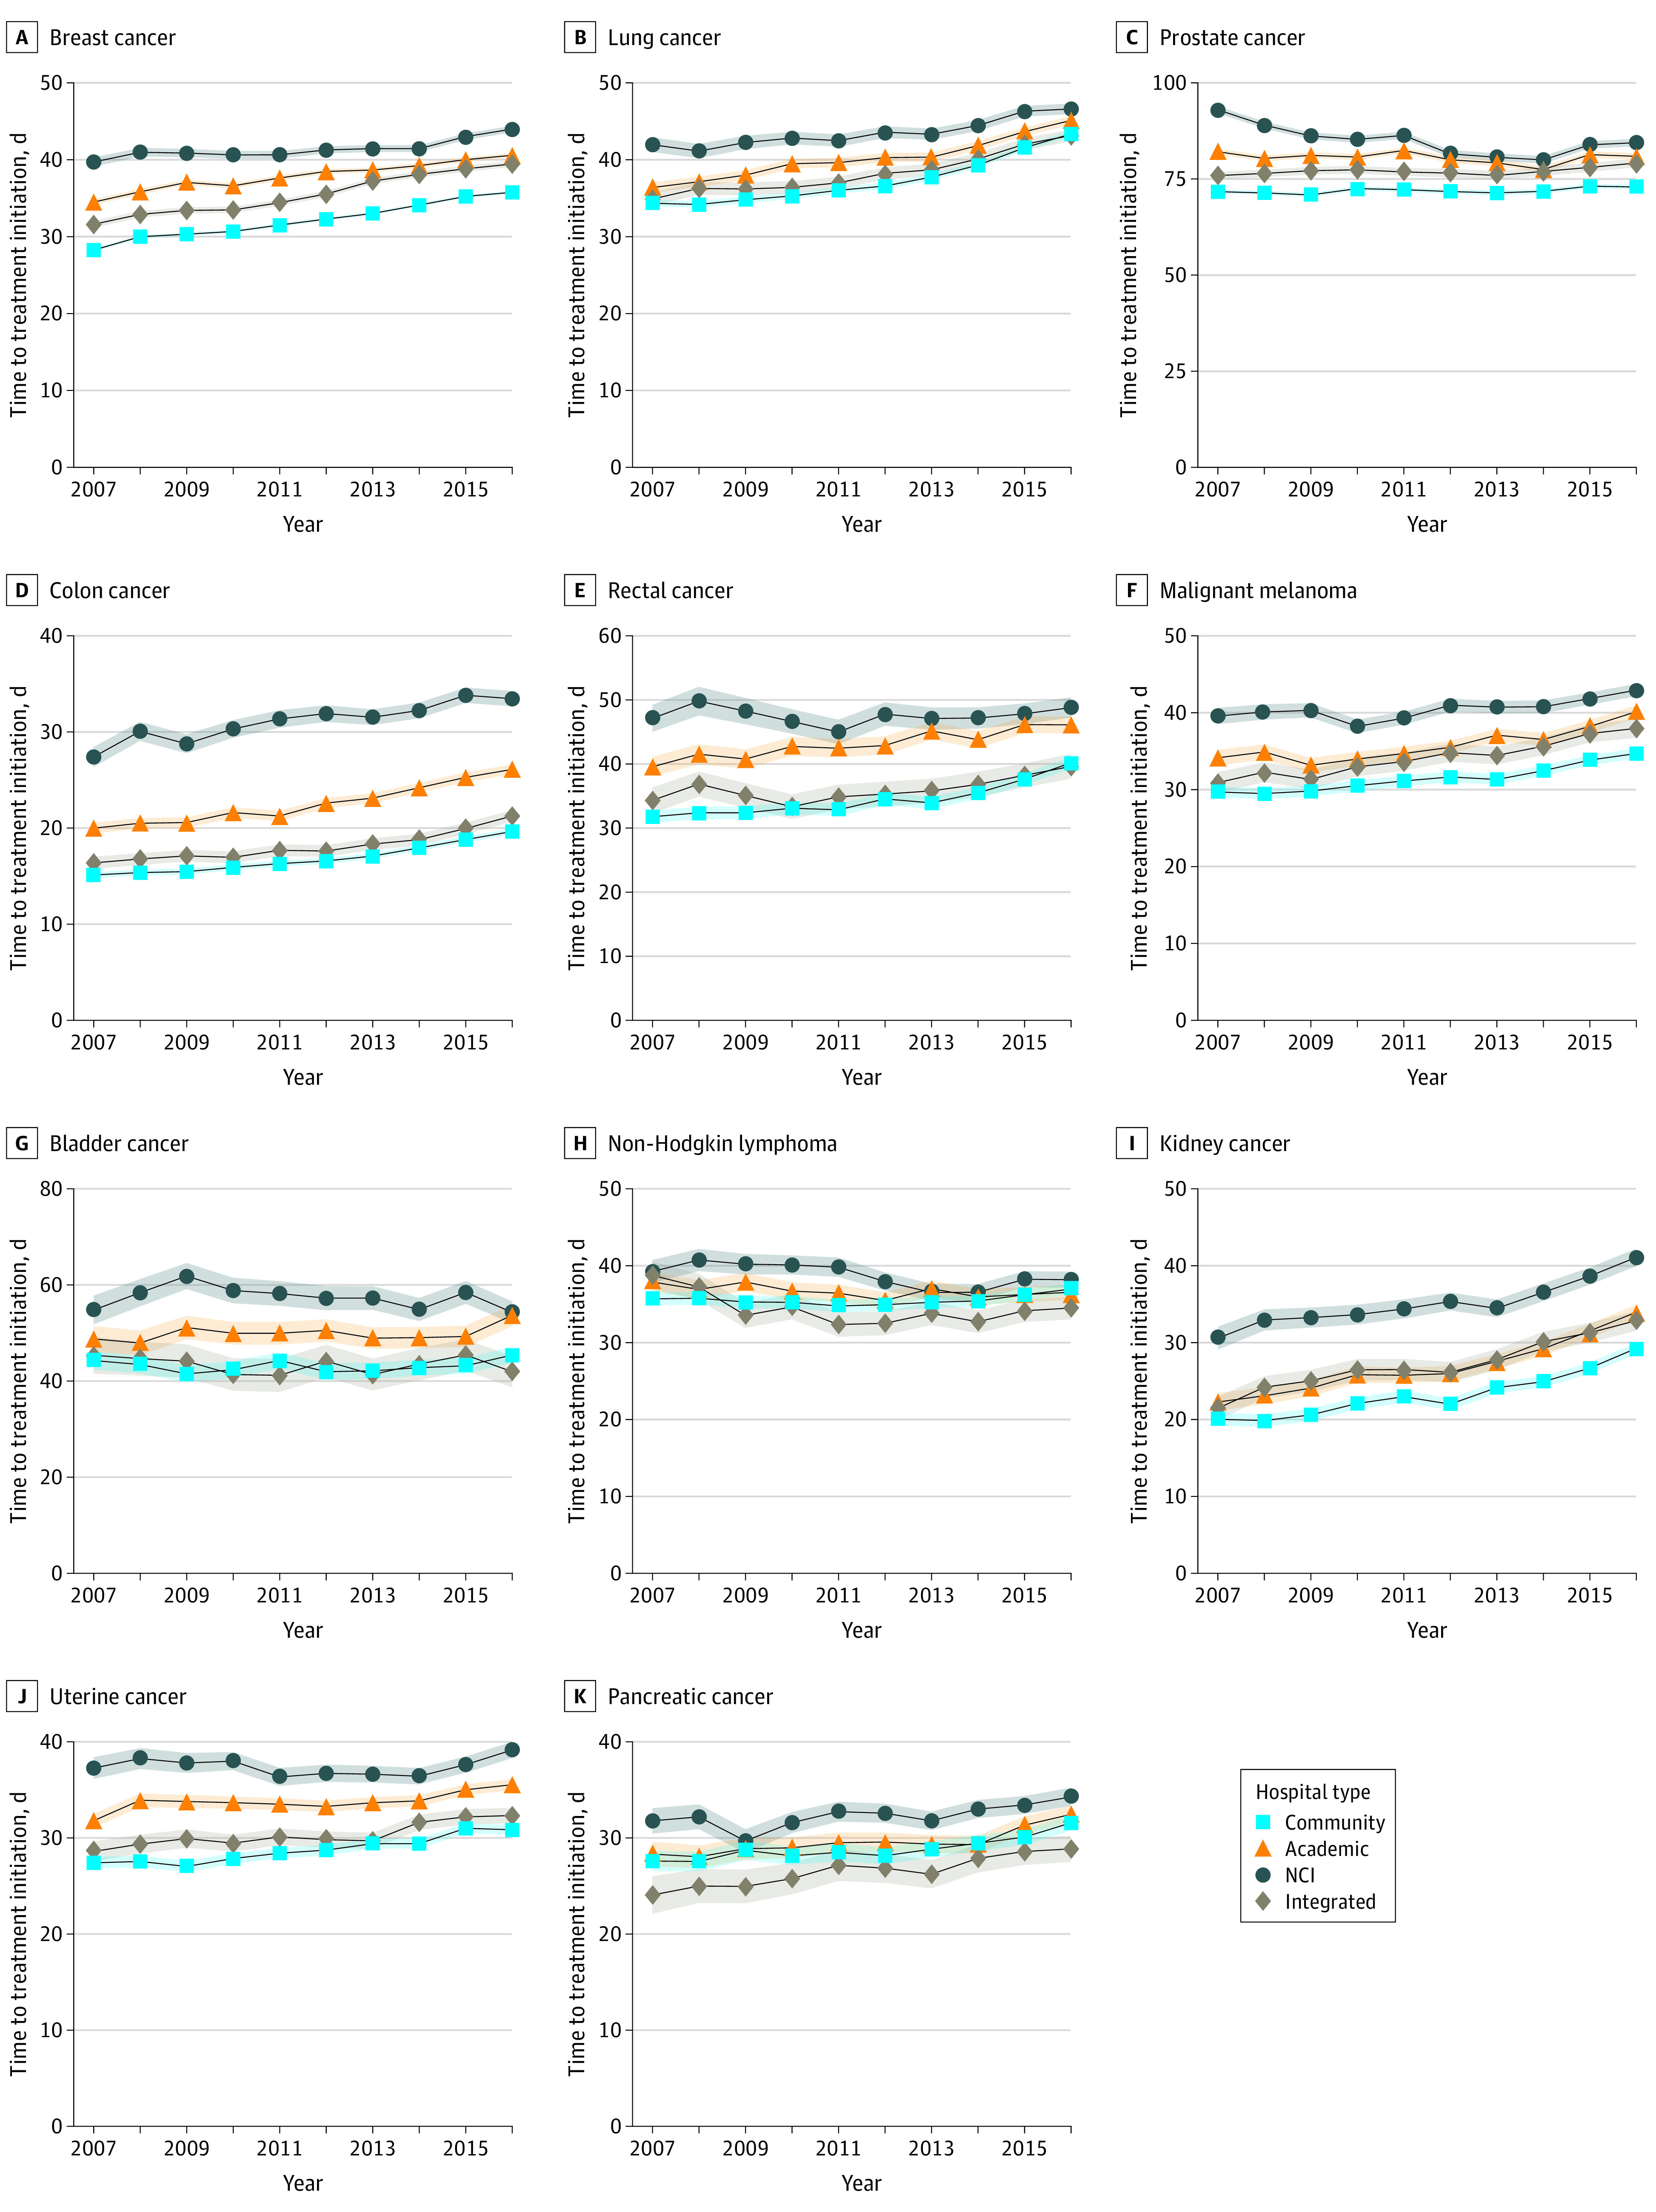
Figure 3. Trends in Unadjusted Time to Treatment Initiation by Hospital Type and Cancer Type From 2007 to 2016.

Shaded areas represent 95% CIs. NCI indicates National Cancer Institute.

Shaded areas represent 95% CIs. NCI indicates National Cancer Institute.