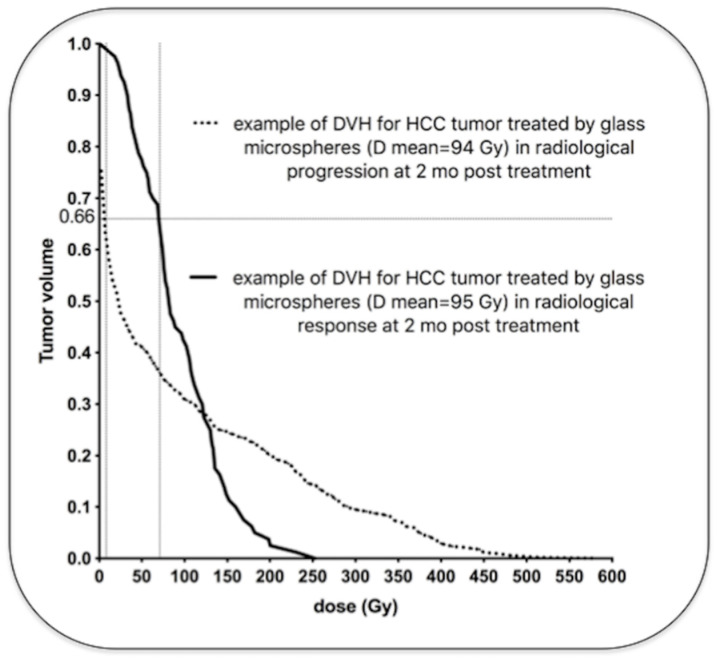
Figure 4.
Examples of two HCC tumors treated with glass microspheres with similar mean absorbed doses (94 and 95 Gy) but very different dose distributions (personal data). One tumor (dotted line) received a very low dose in a large part of the tumor volume (more than 5 Gy in 66% of the tumor volume), and was in radiological progression two months later. The other tumor (solid line) received a high dose in a large part of the tumor volume (more than 69 Gy in 66% of the tumor volume) and was in radiological response two months later. Note that the cluster with the highest local dose was found in the non-responding tumor (>500 Gy) because of the major heterogeneous distribution.

