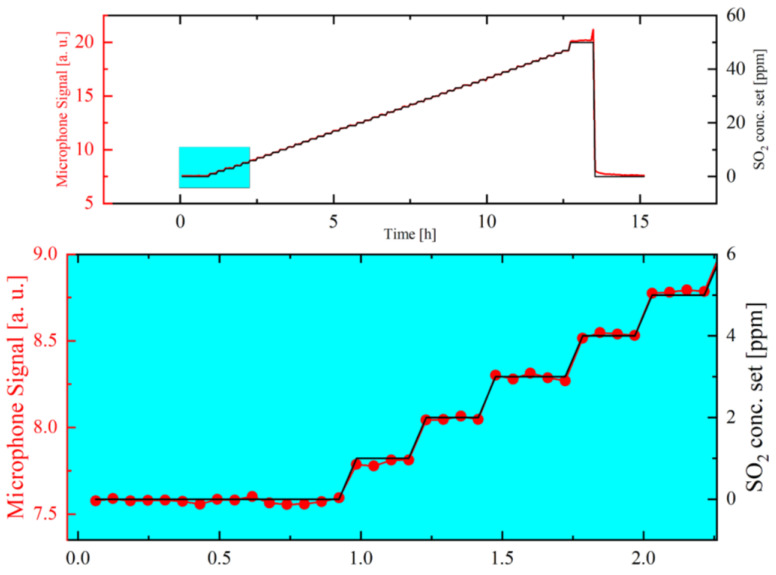
Figure 7.
The microphone signal (red curve) in relation to the set SO2 concentration (black curve), which is varied between 0 and 50 ppm using pre-calibrated mass flow controllers. Upper graph: The detected microphone signal in relation to the set SO2 concentrations over a period of 15 h. Lower graph: zoom graph of the microphone signal at the first five concentration variations resembling the set SO2 concentrations 0 up to 5 ppm.

