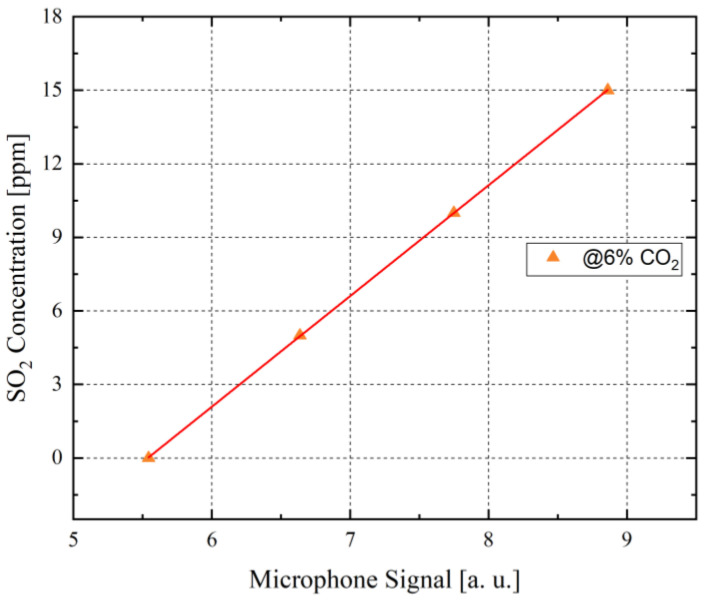
Figure 11.
The microphone signal in relation to the set SO2 concentrations at a constant CO2 concentration of 6 vol.-%, using pre-calibrated mass flow controllers to conduct these measurements in the laboratory. The detected microphone signals and the set SO2 concentrations show a clear linear relation. An increase of the SO2 concentration increases the corresponding microphone signal. This graph is used as a reference to estimate the measured SO2 concentration from the detected microphone signal during the field test.

